Fig. 6
From:Transcriptome architecture reveals genetic networks of bolting regulation in spinach

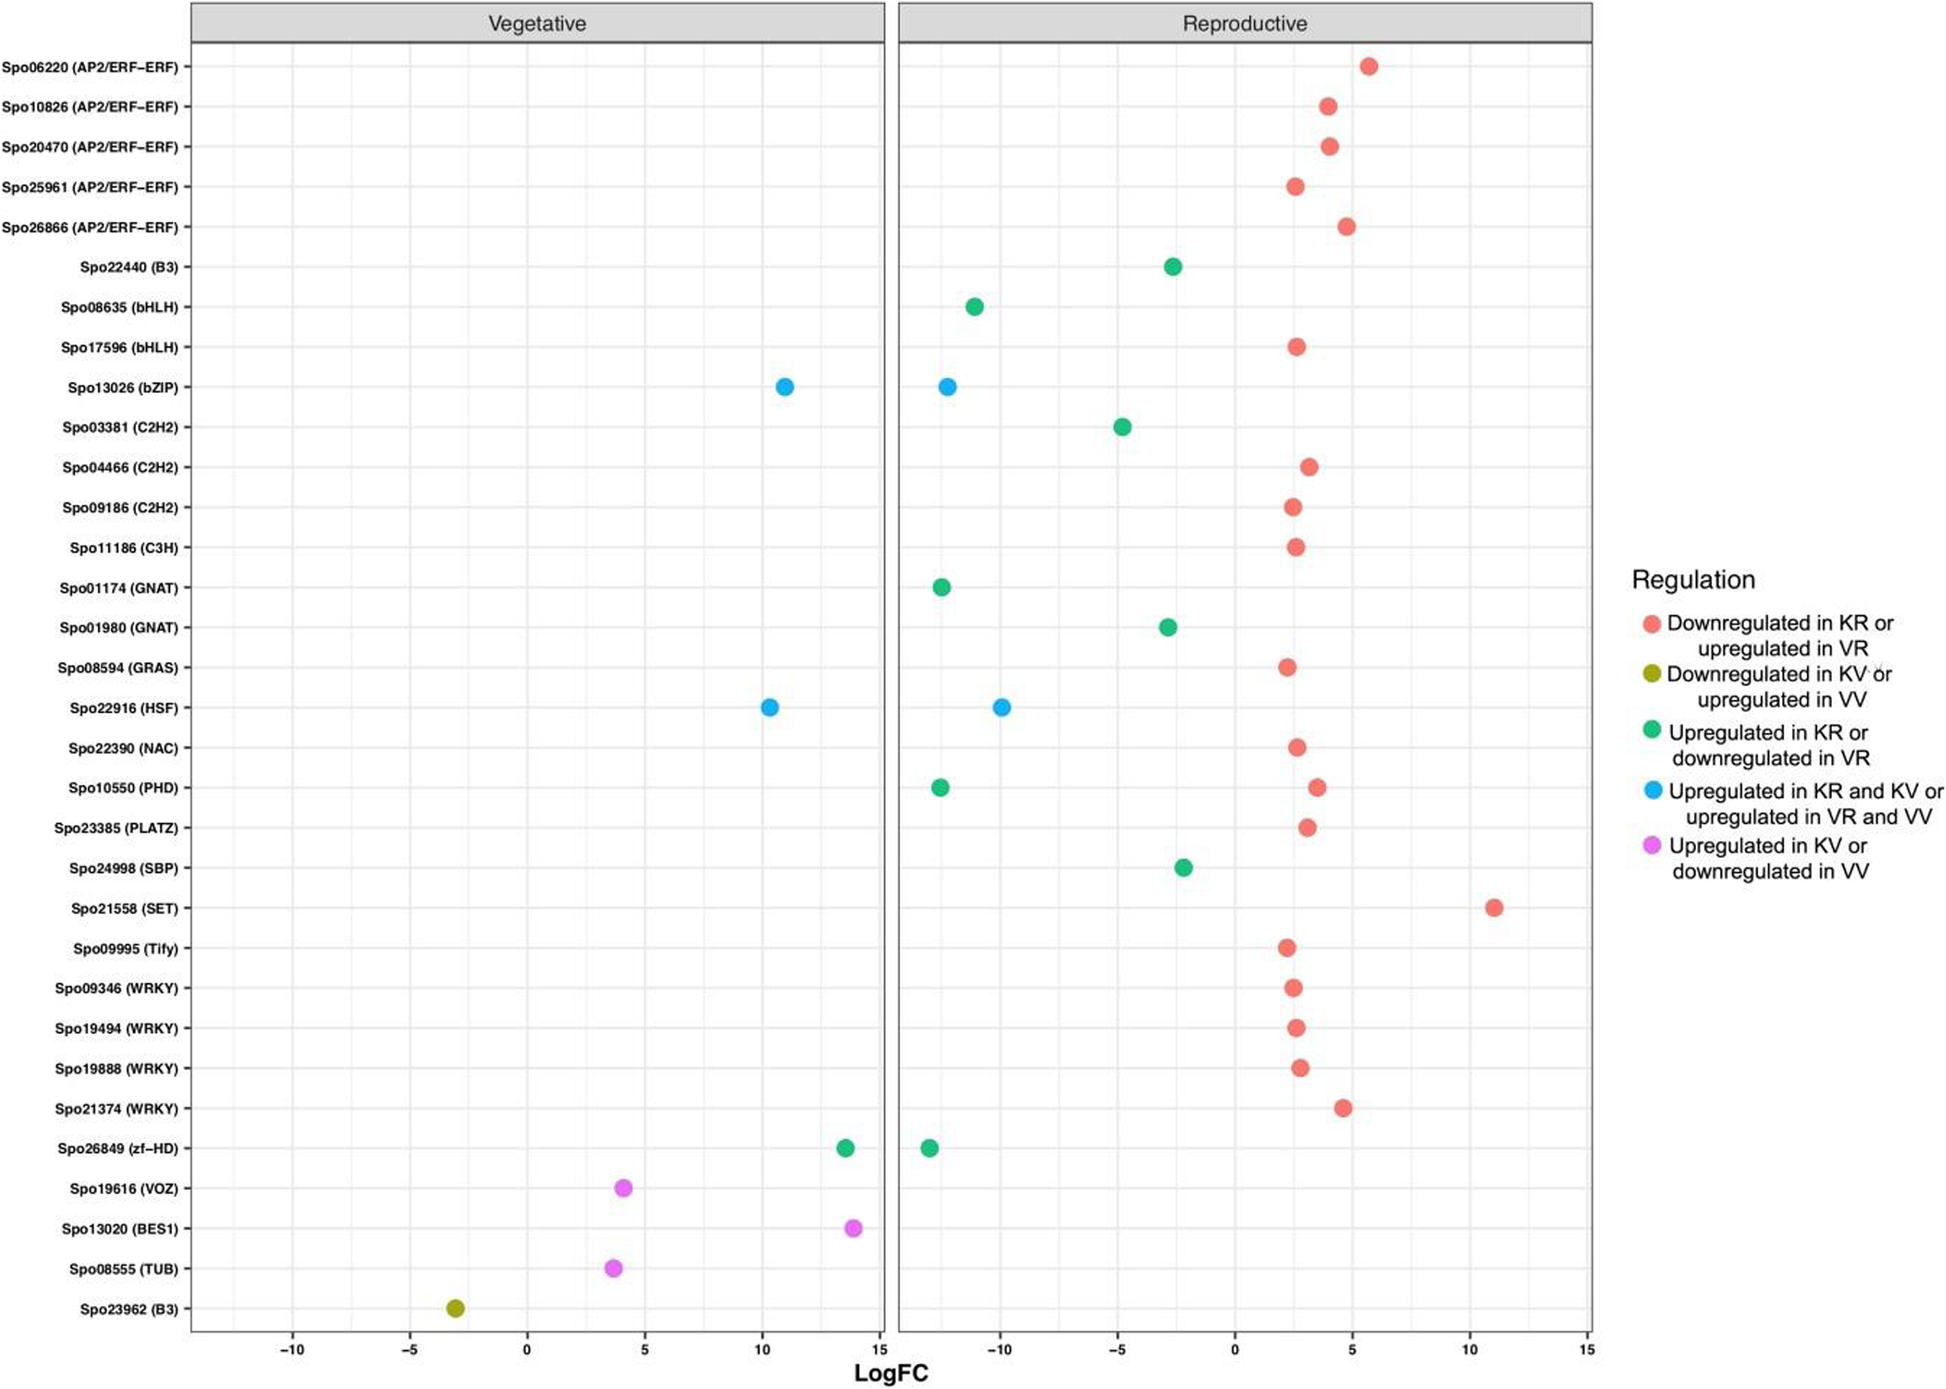
A scatter plot of differentially expressed TFs predicted from accessions comparison in each stage. The y-axis represents the name of TFs, and the x-axis represents the values of the log-fold change. KV, KR, VV, and VR represent Kashan-vegetative, Kashan-reproductive, Viroflay-vegetative, and Viroflay-reproductive, respectively
