Fig. 2
From:Transcriptome architecture reveals genetic networks of bolting regulation in spinach

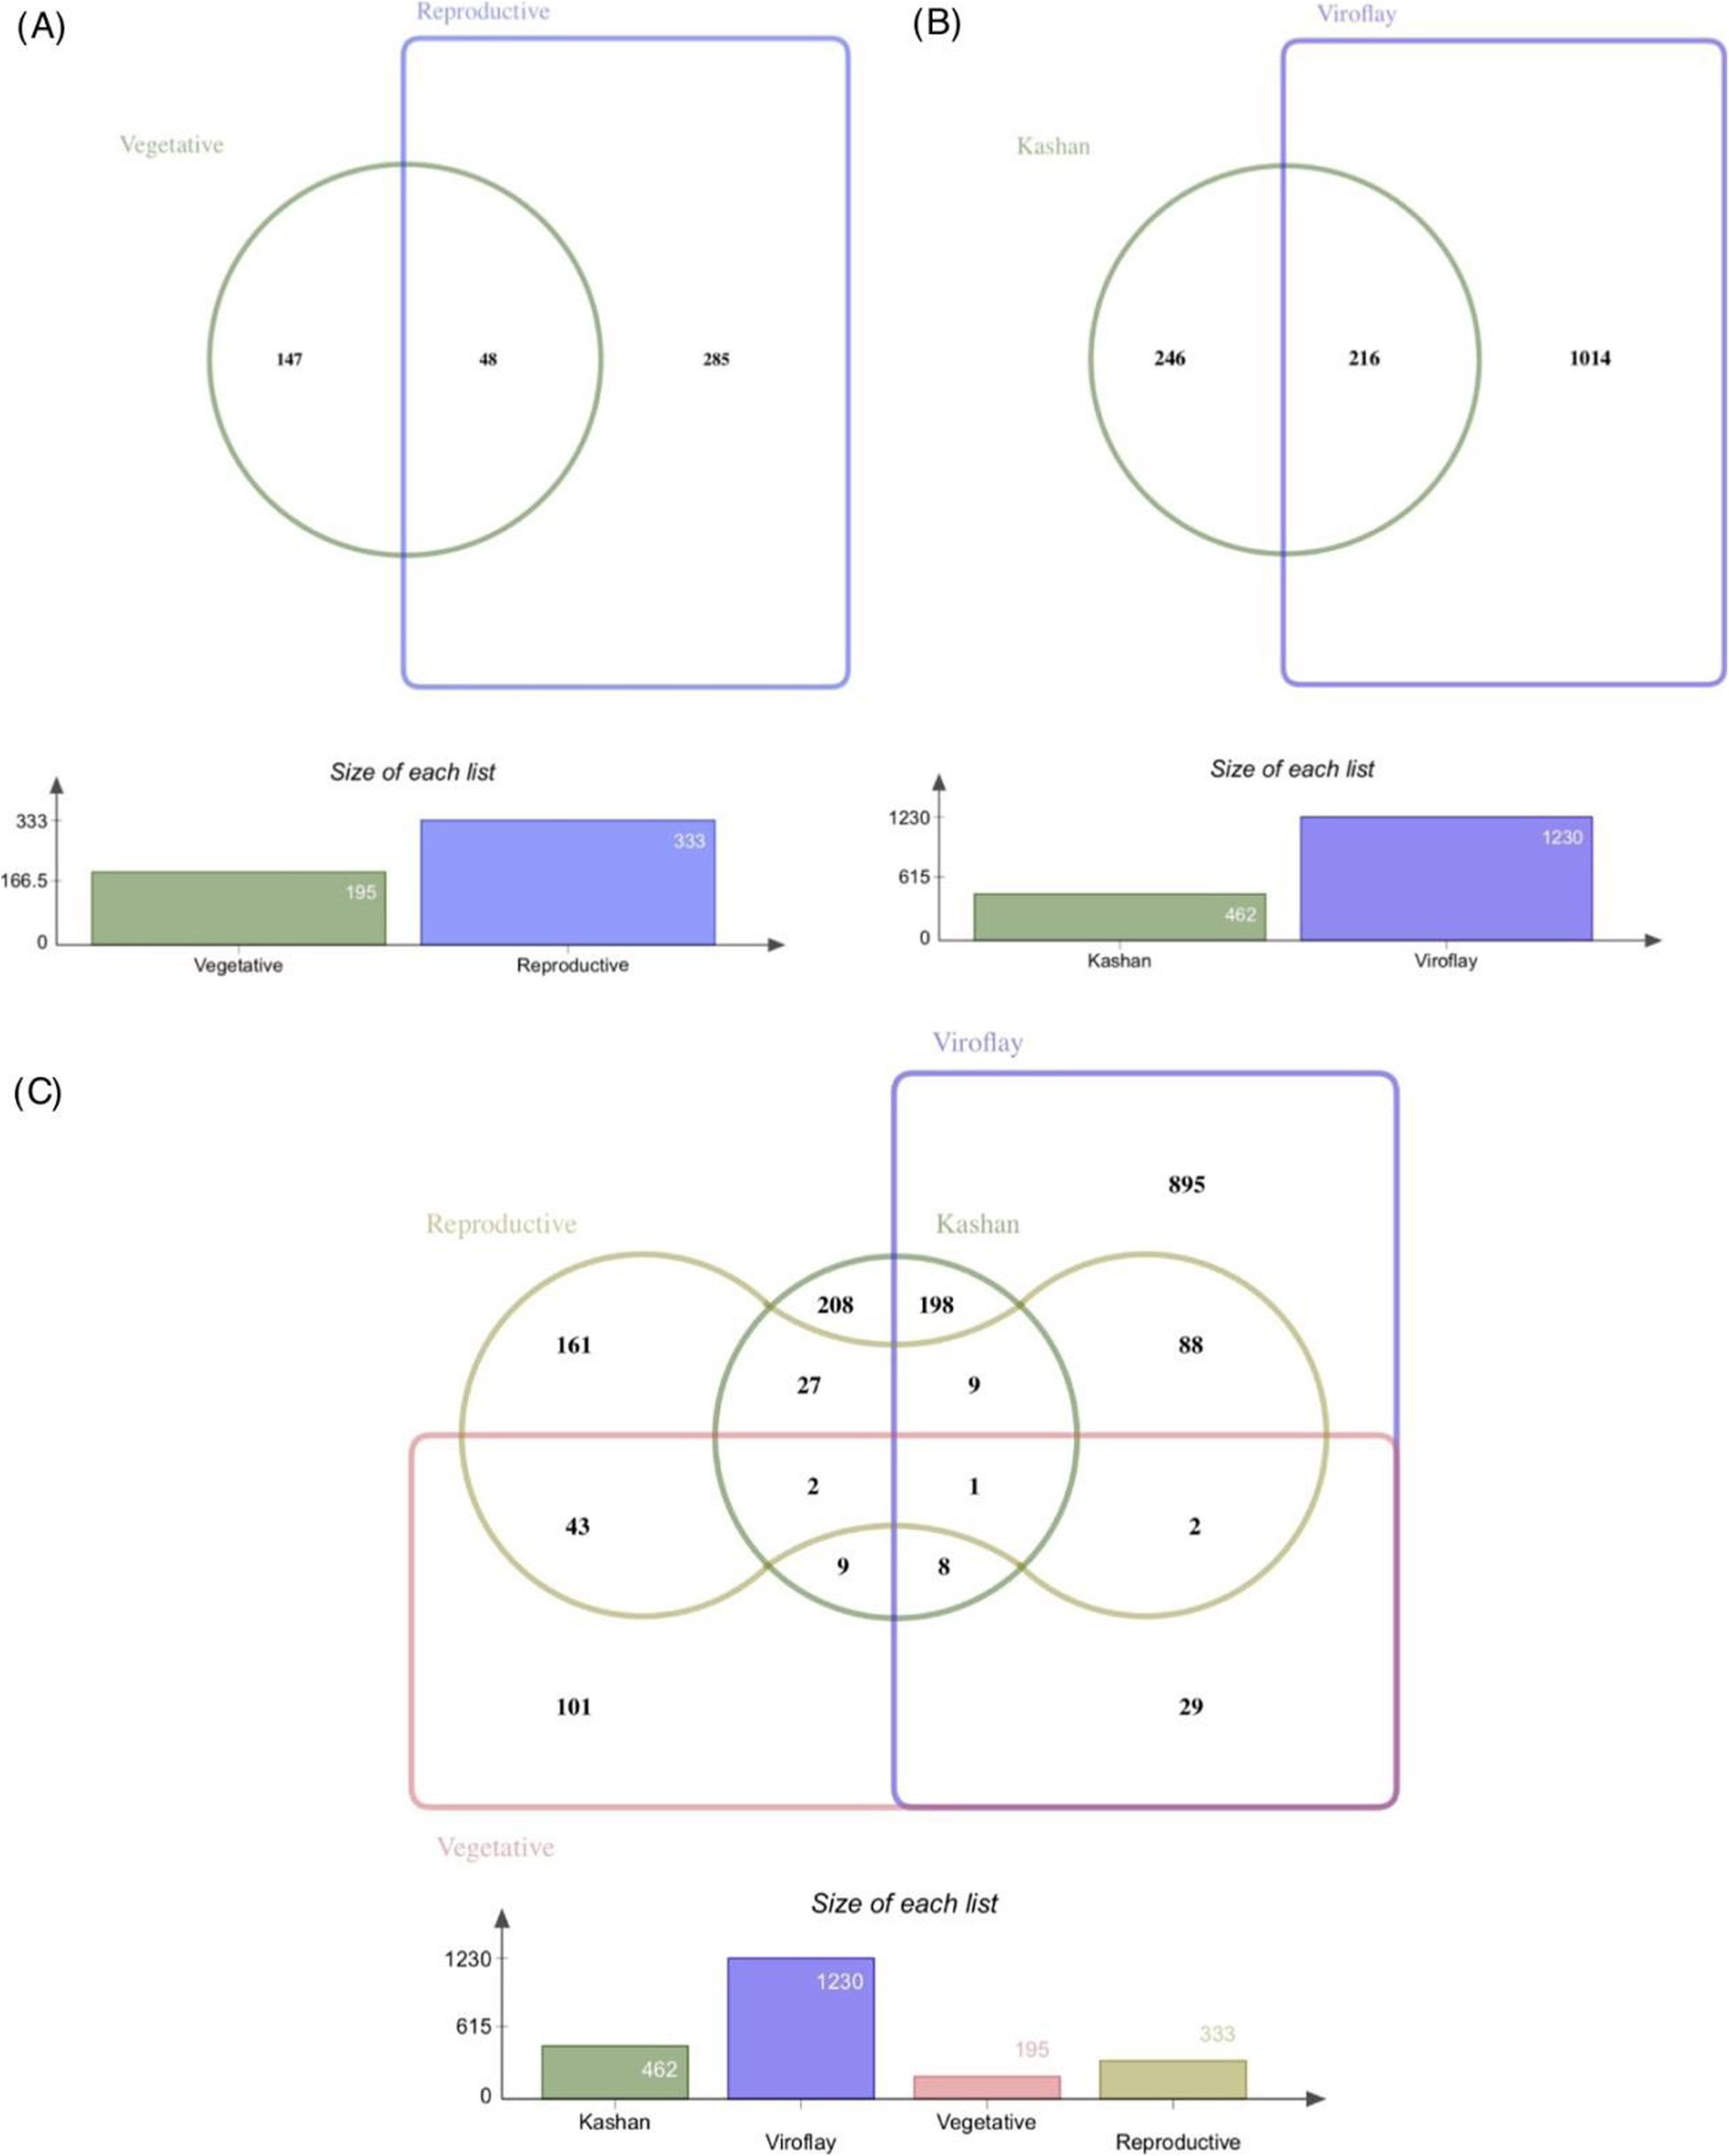
Venn diagram showing the distribution of unique and common DEGs among comparisons. The number of DEGs commonly shared between stages in the accessions comparison (a), between accessions under stages comparison (b) and both stages and accessions comparison (c)
