Fig. 1

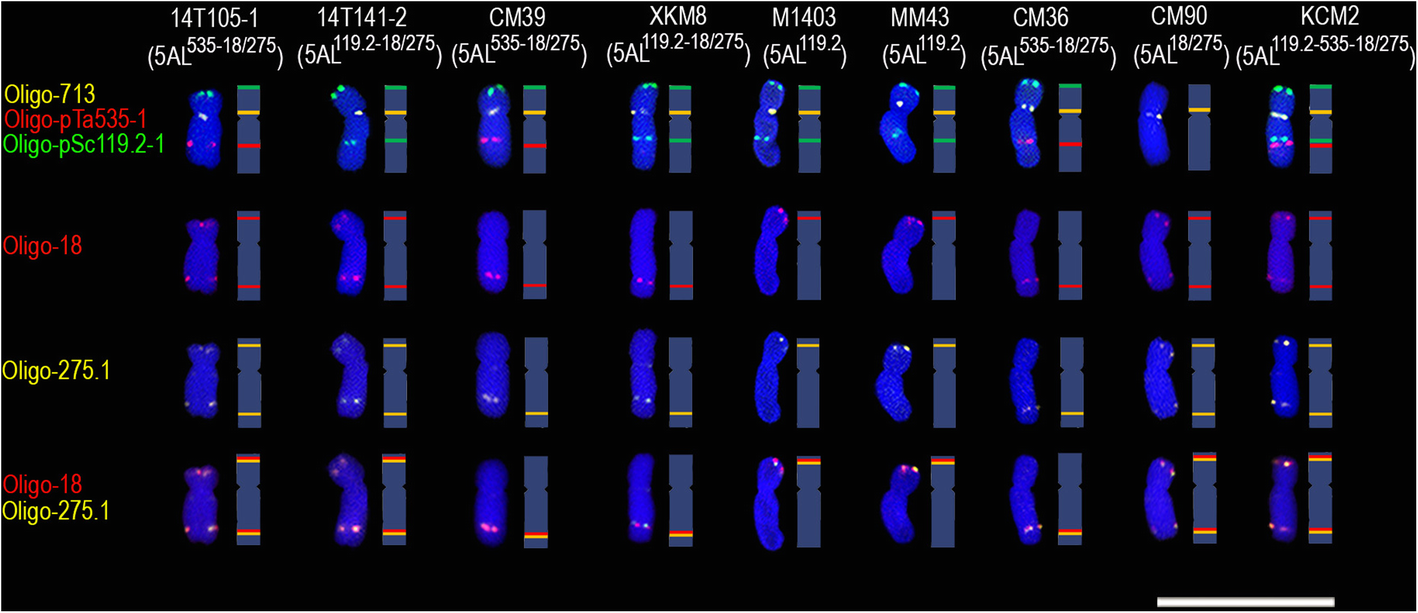
Signal patterns of five oligo probes on the metaphase 5A chromosomes of nine wheat cultivars/lines. The schematic representation of each chromosome is shown. Scale bar: 50 μm

Signal patterns of five oligo probes on the metaphase 5A chromosomes of nine wheat cultivars/lines. The schematic representation of each chromosome is shown. Scale bar: 50 μm