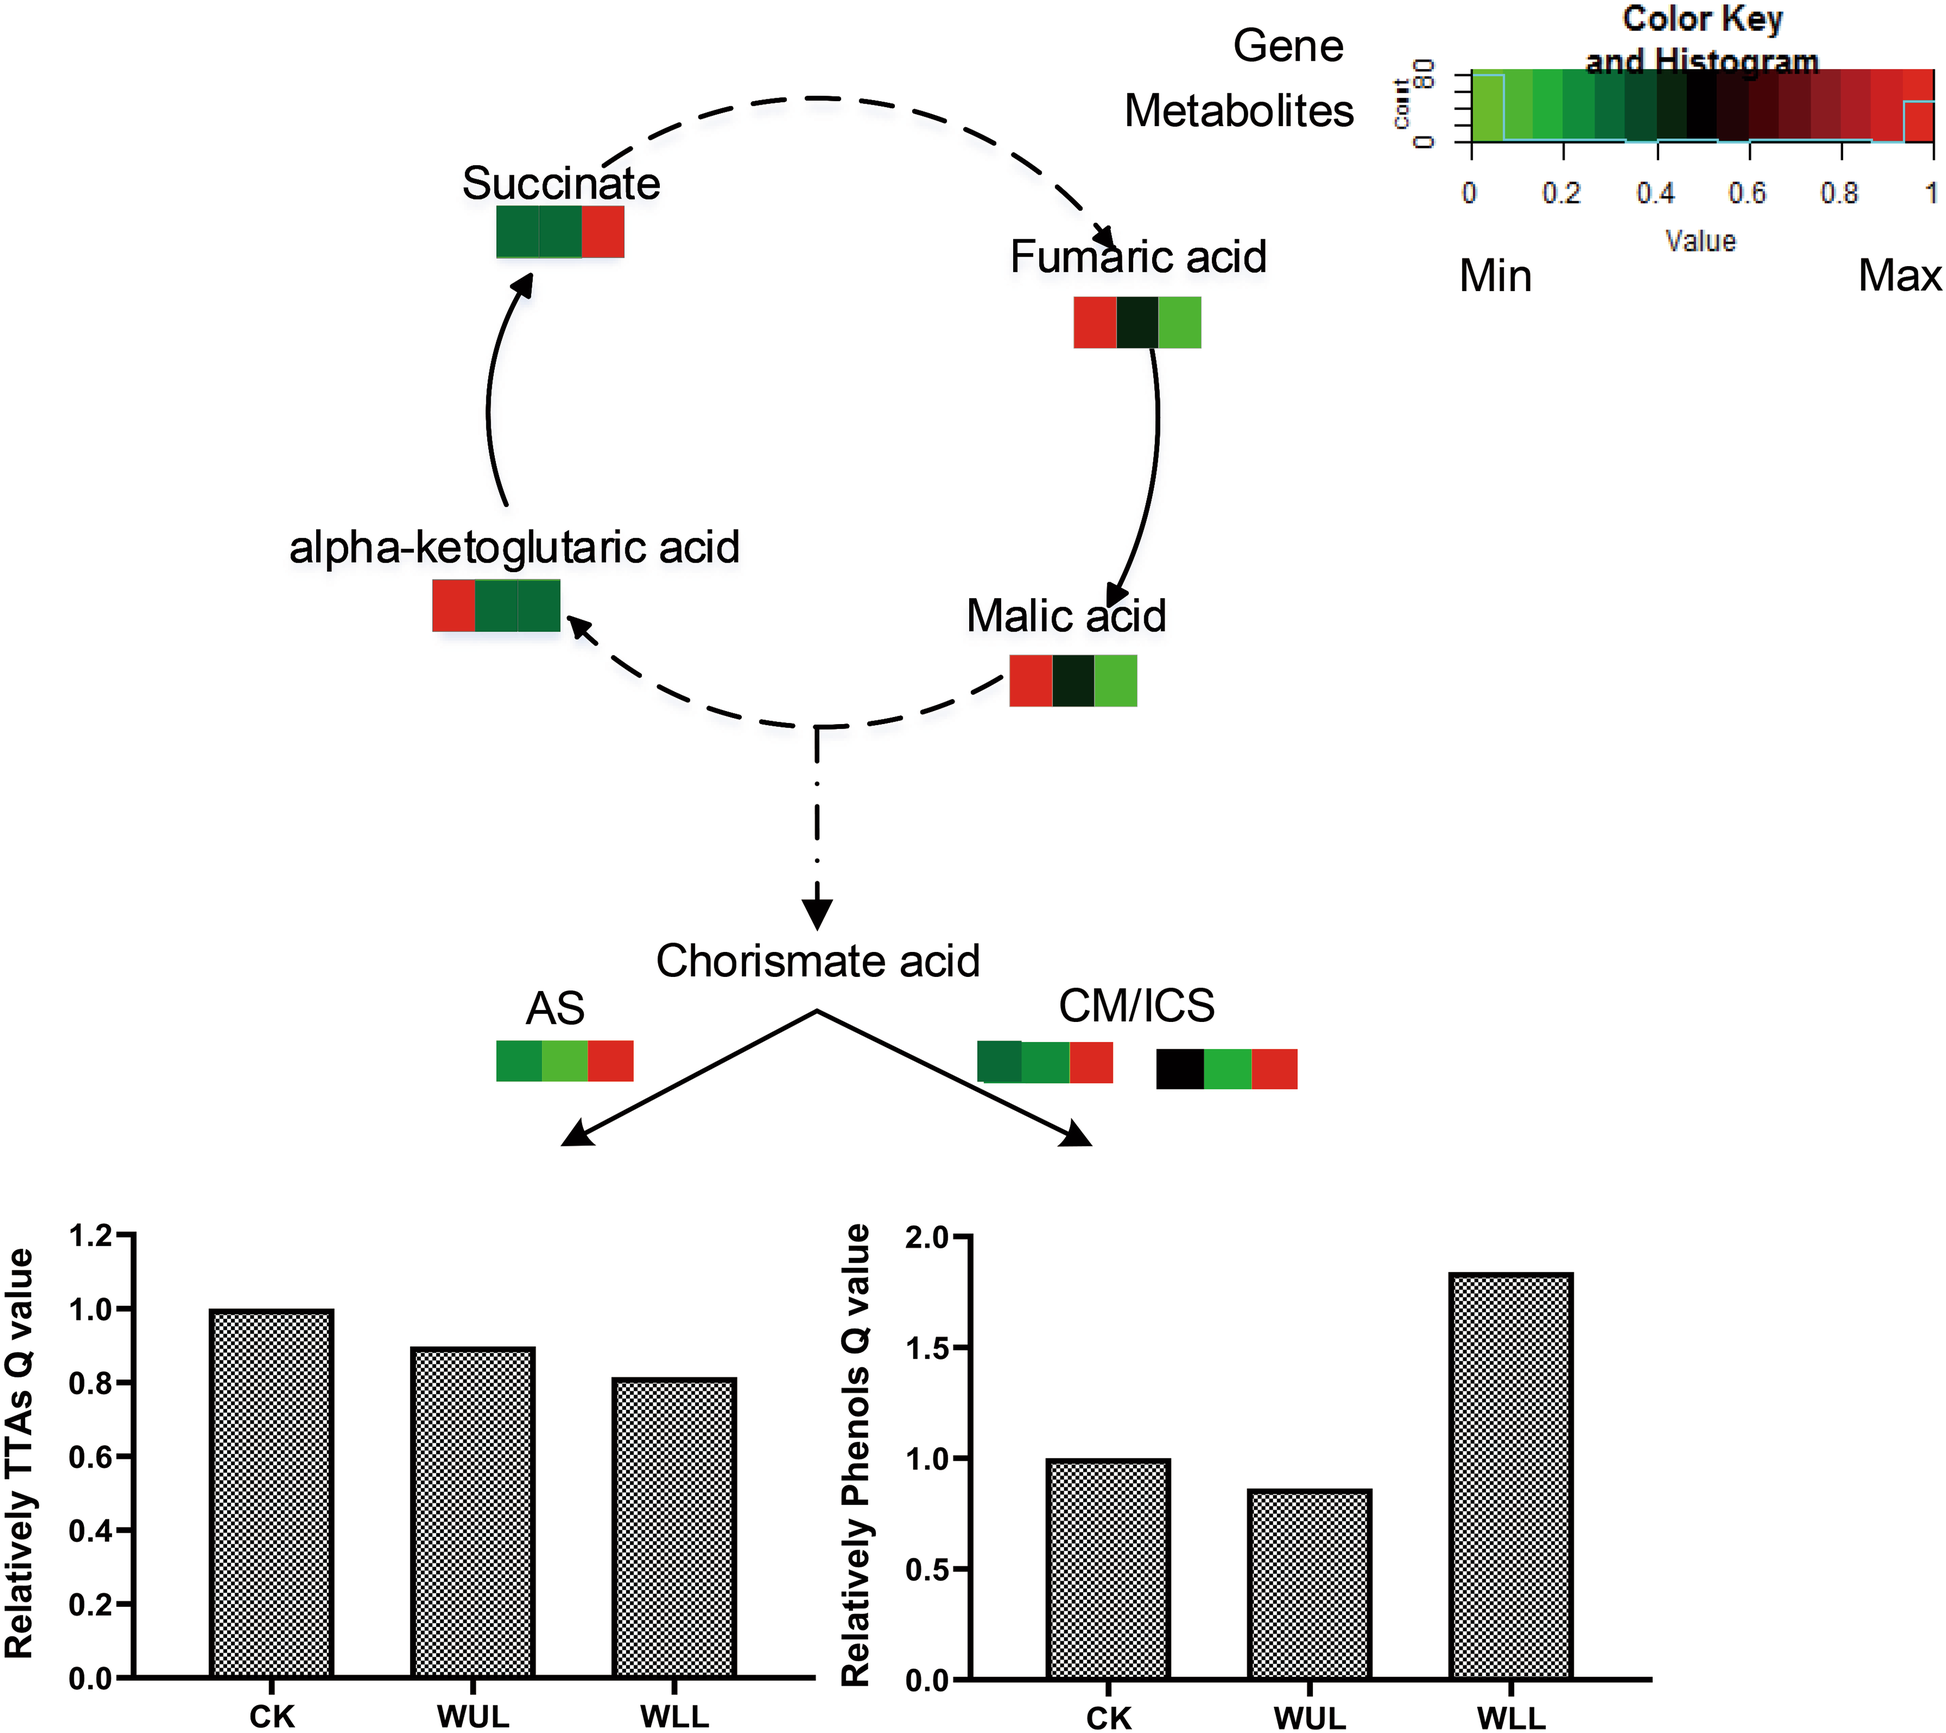
Fig. 6

Metabolic allocation map. The grid shows the CK, WUL and WLL groups from left to right; the content from low to high is indicated by the color scale from blue to red, respectively; a solid line represents a one-step reaction, and a dotted line represents a multistep reaction; the TIA Q values and phenol Q values are represented in a histogram; CK: control group, WUL: damaged upper leaf group, WLL: damaged lower leaf group
