Fig. 2

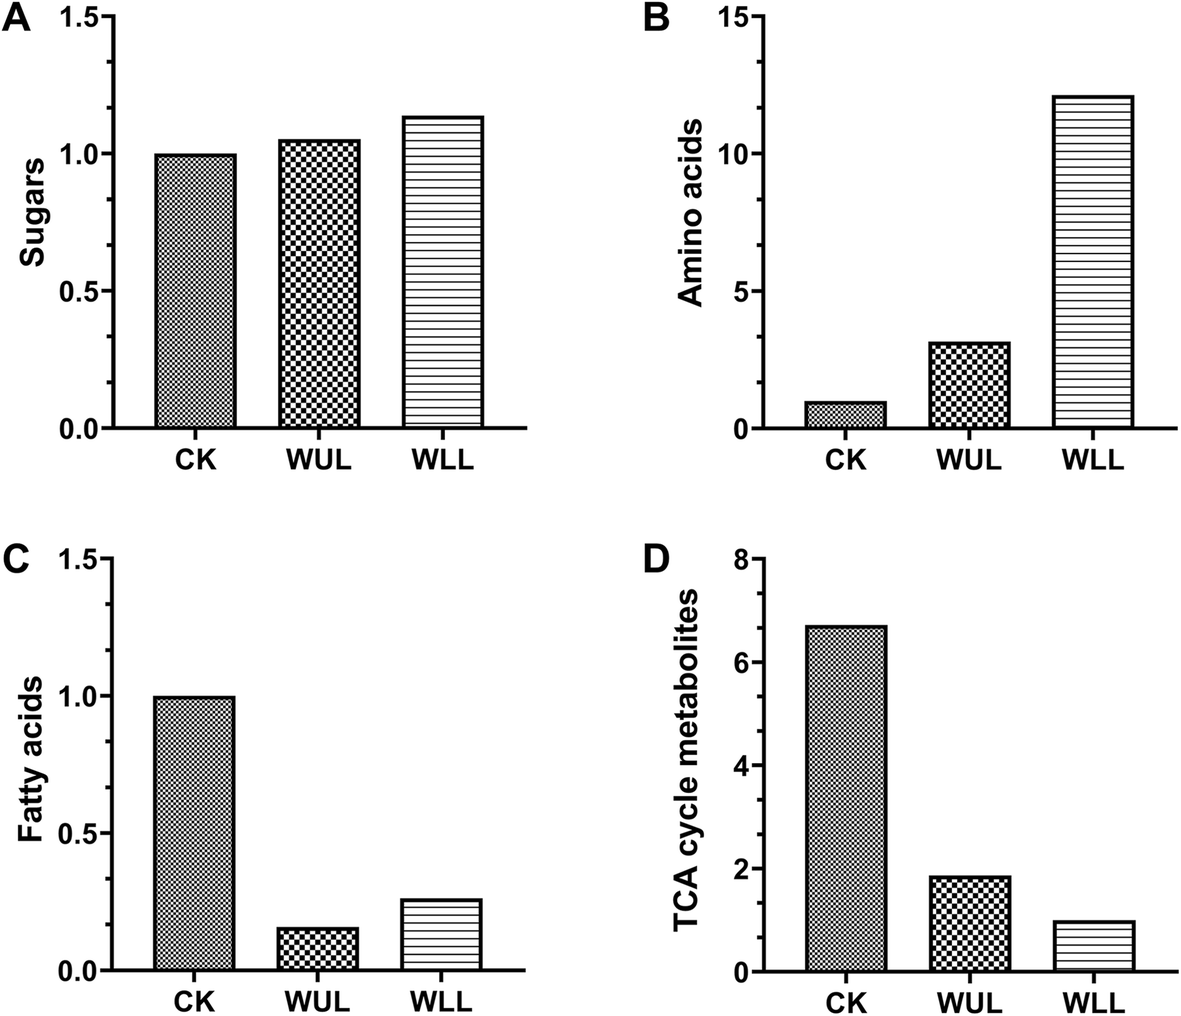
The relative content Q-values for major primary metabolites were analyzed using GC-MS:a. Sugars,b. Amino acids,c. fatty acids,d. TCA cycle metabolites; Control group, CK; Damaged upper leaf group, WUL; Damaged lower leaf, WLL

The relative content Q-values for major primary metabolites were analyzed using GC-MS:a. Sugars,b. Amino acids,c. fatty acids,d. TCA cycle metabolites; Control group, CK; Damaged upper leaf group, WUL; Damaged lower leaf, WLL