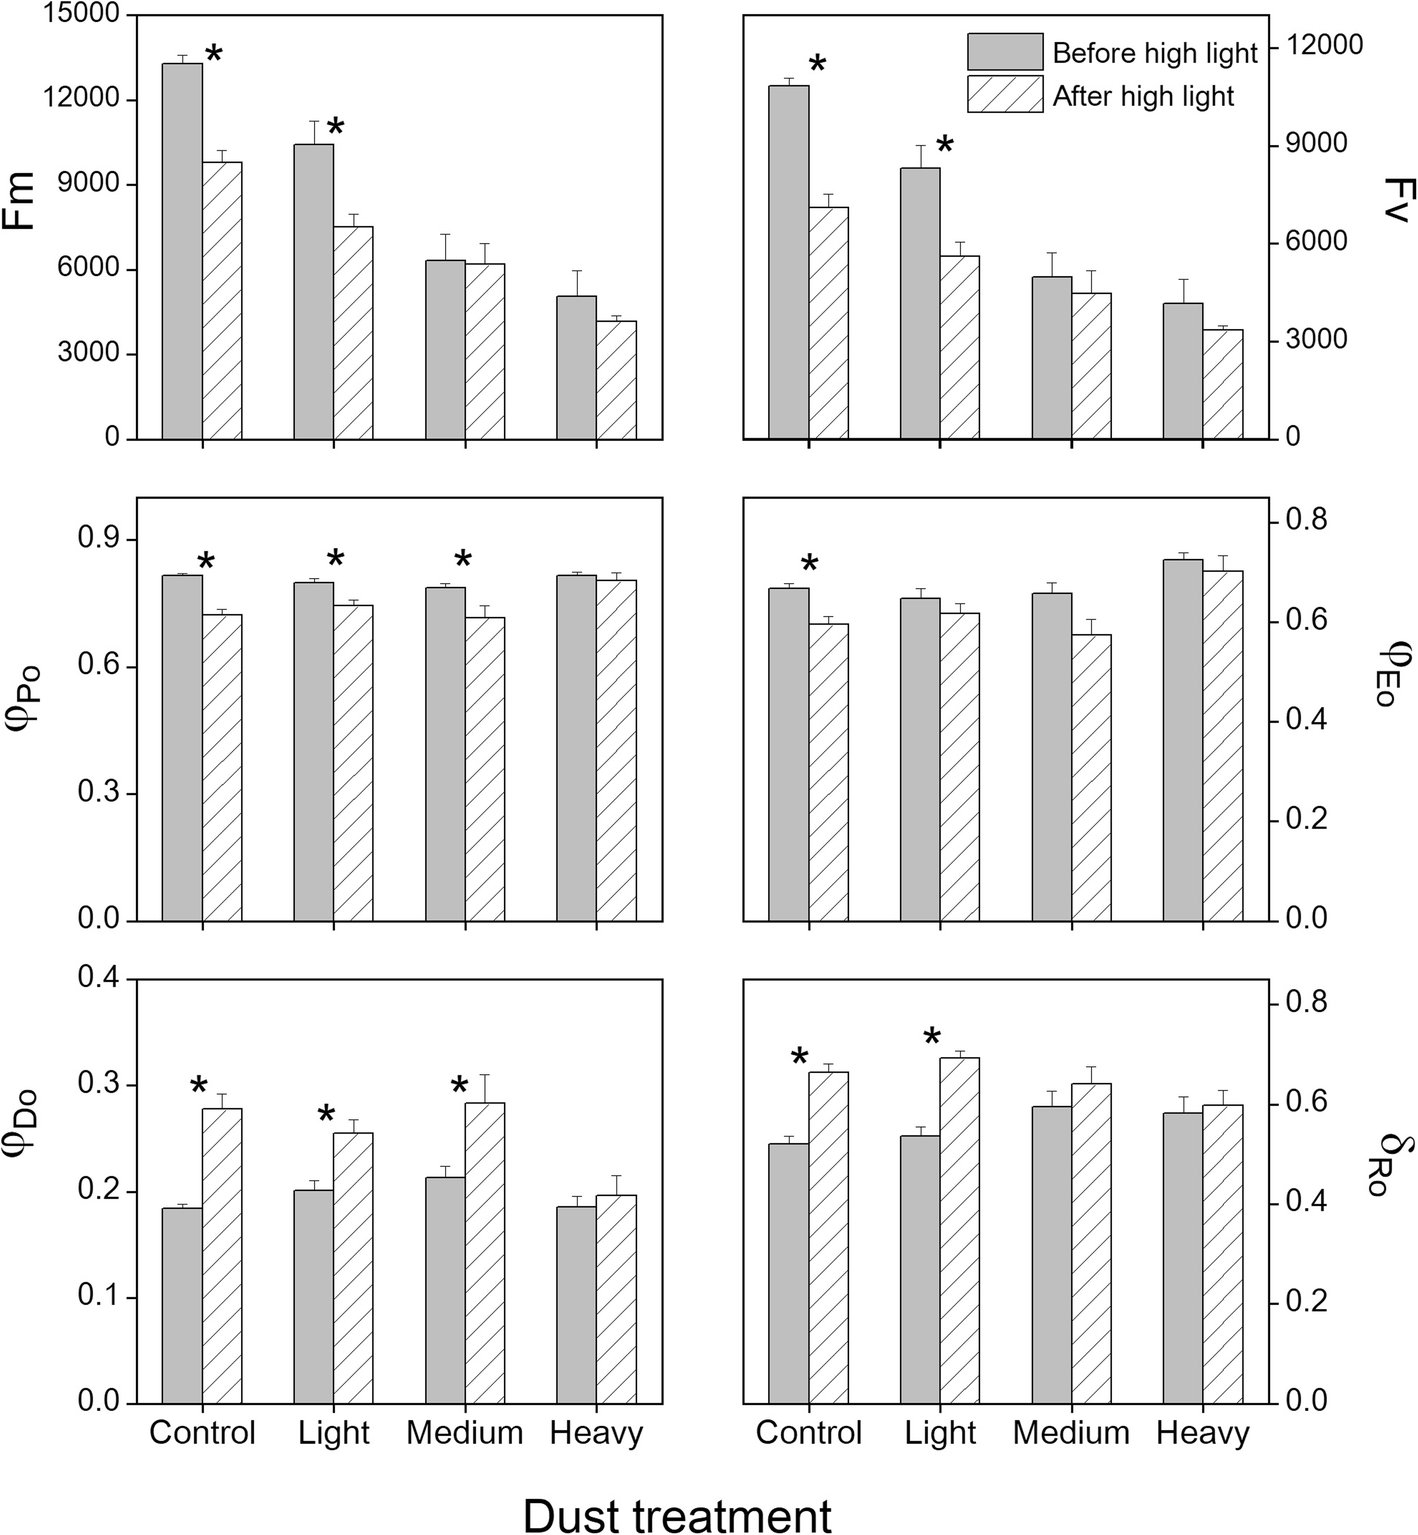
Fig. 2

The selected fluorescence parameters of cotton leaves in the control, and after dust accumulation (light, medium, and heavy). The values shown are the mean of five replicates. Bars represent the standard error. Asterisks (*) indicate significant differences between before and after high-light treatments at 0.05% level
