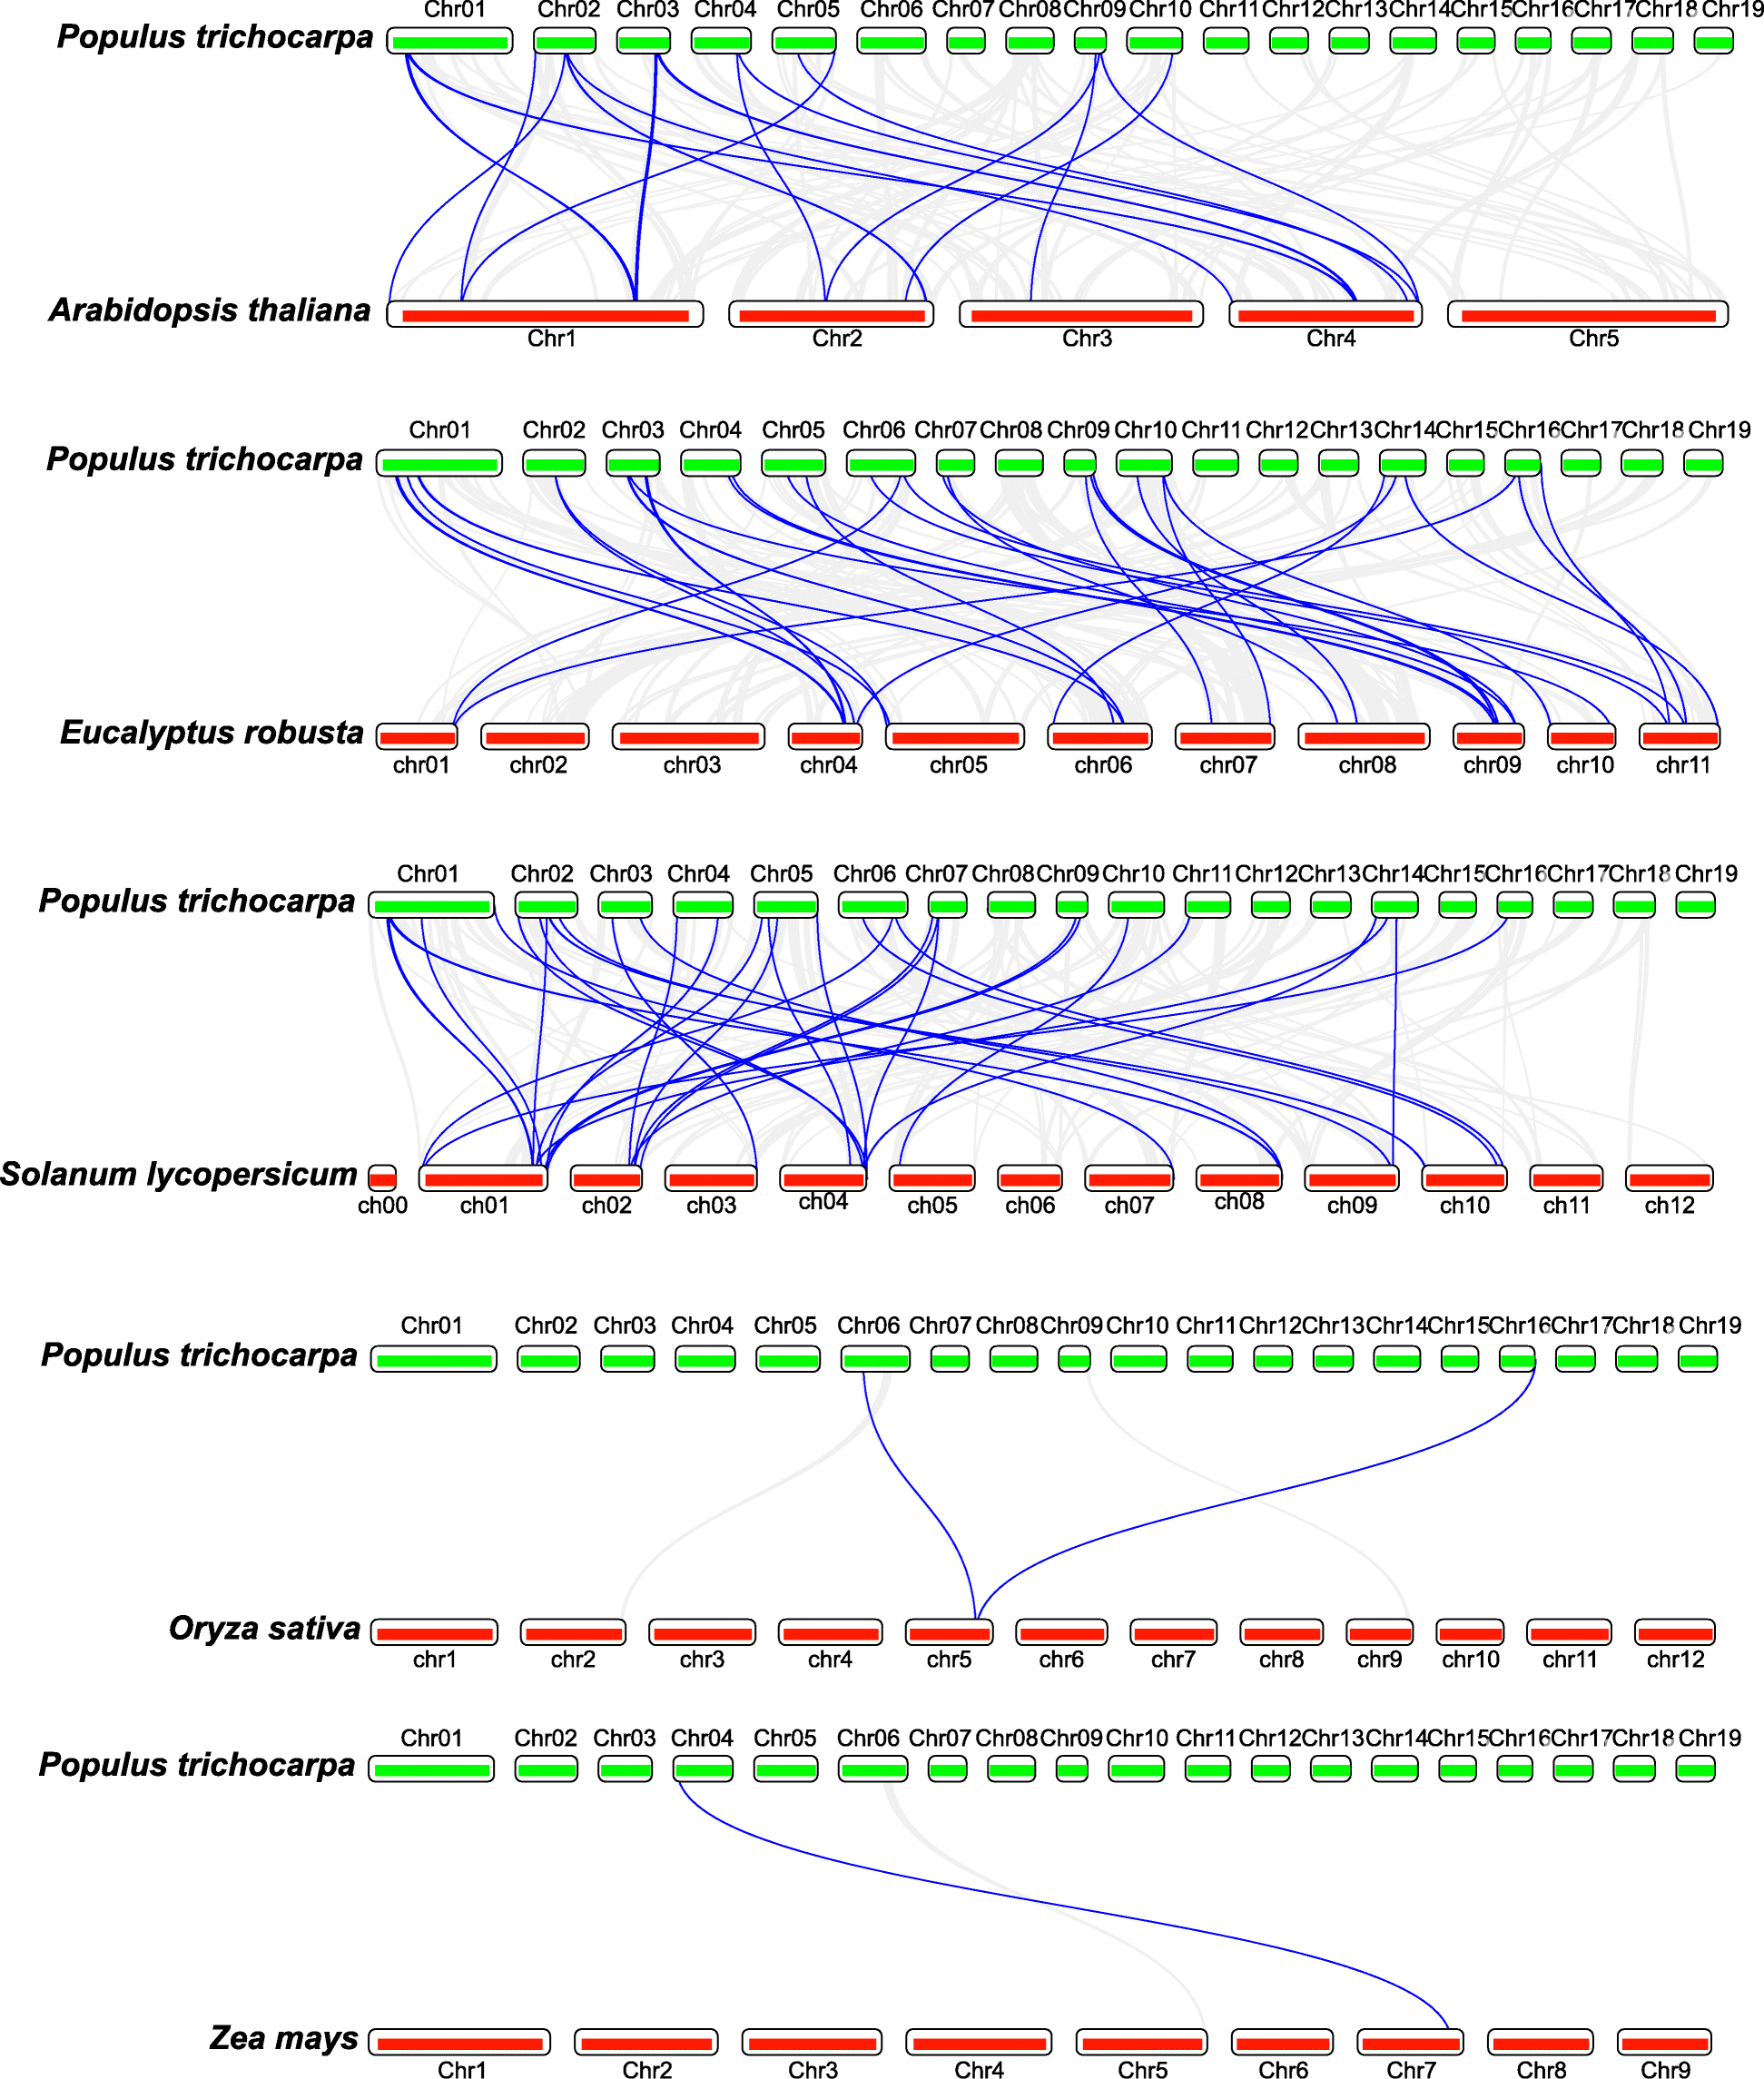
Fig. 4

Collinearity map of thePtrLEAgenes in poplar to other five species. The blue lines denote collinearity between thePtrLEAgenes and other species, while the gray lines represent collinearity between the poplar genome and other species
