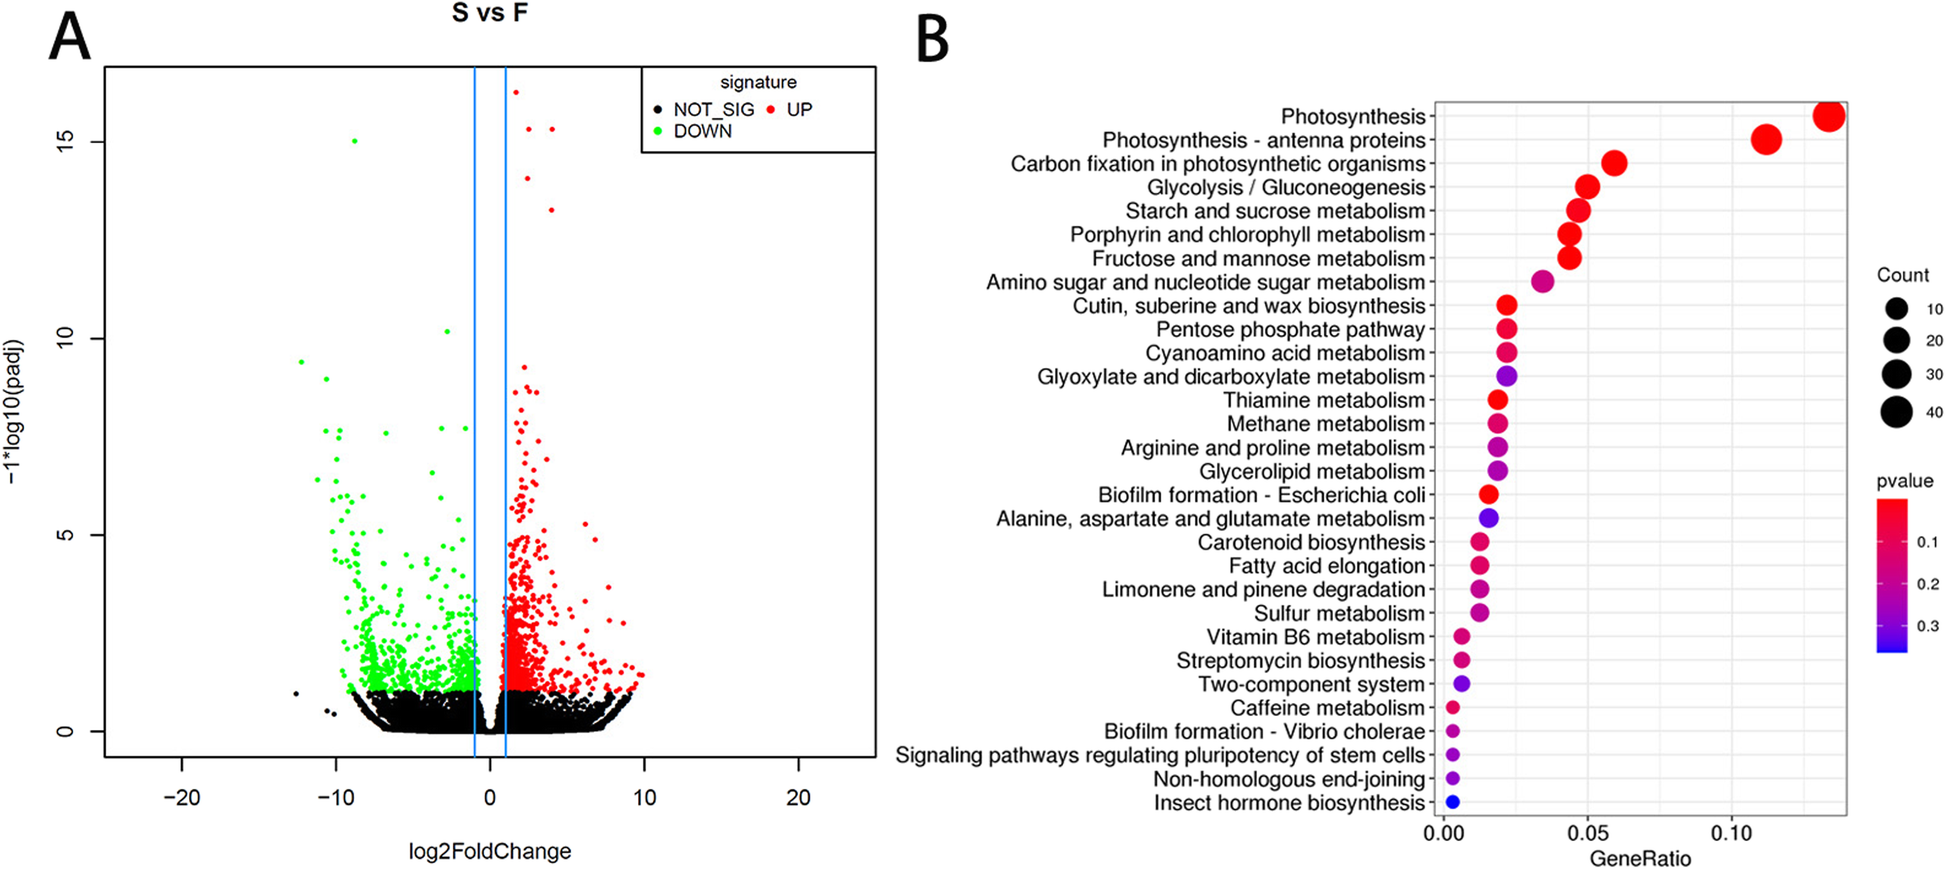
Fig. 6

Transcriptome analysis results.aVolcano plot of the results of transcriptome analysis of significantly differentially expressed gene clusters.bKEGG pathway functional annotation gene distribution map of significantly differentially expressed genes
