Fig. 4

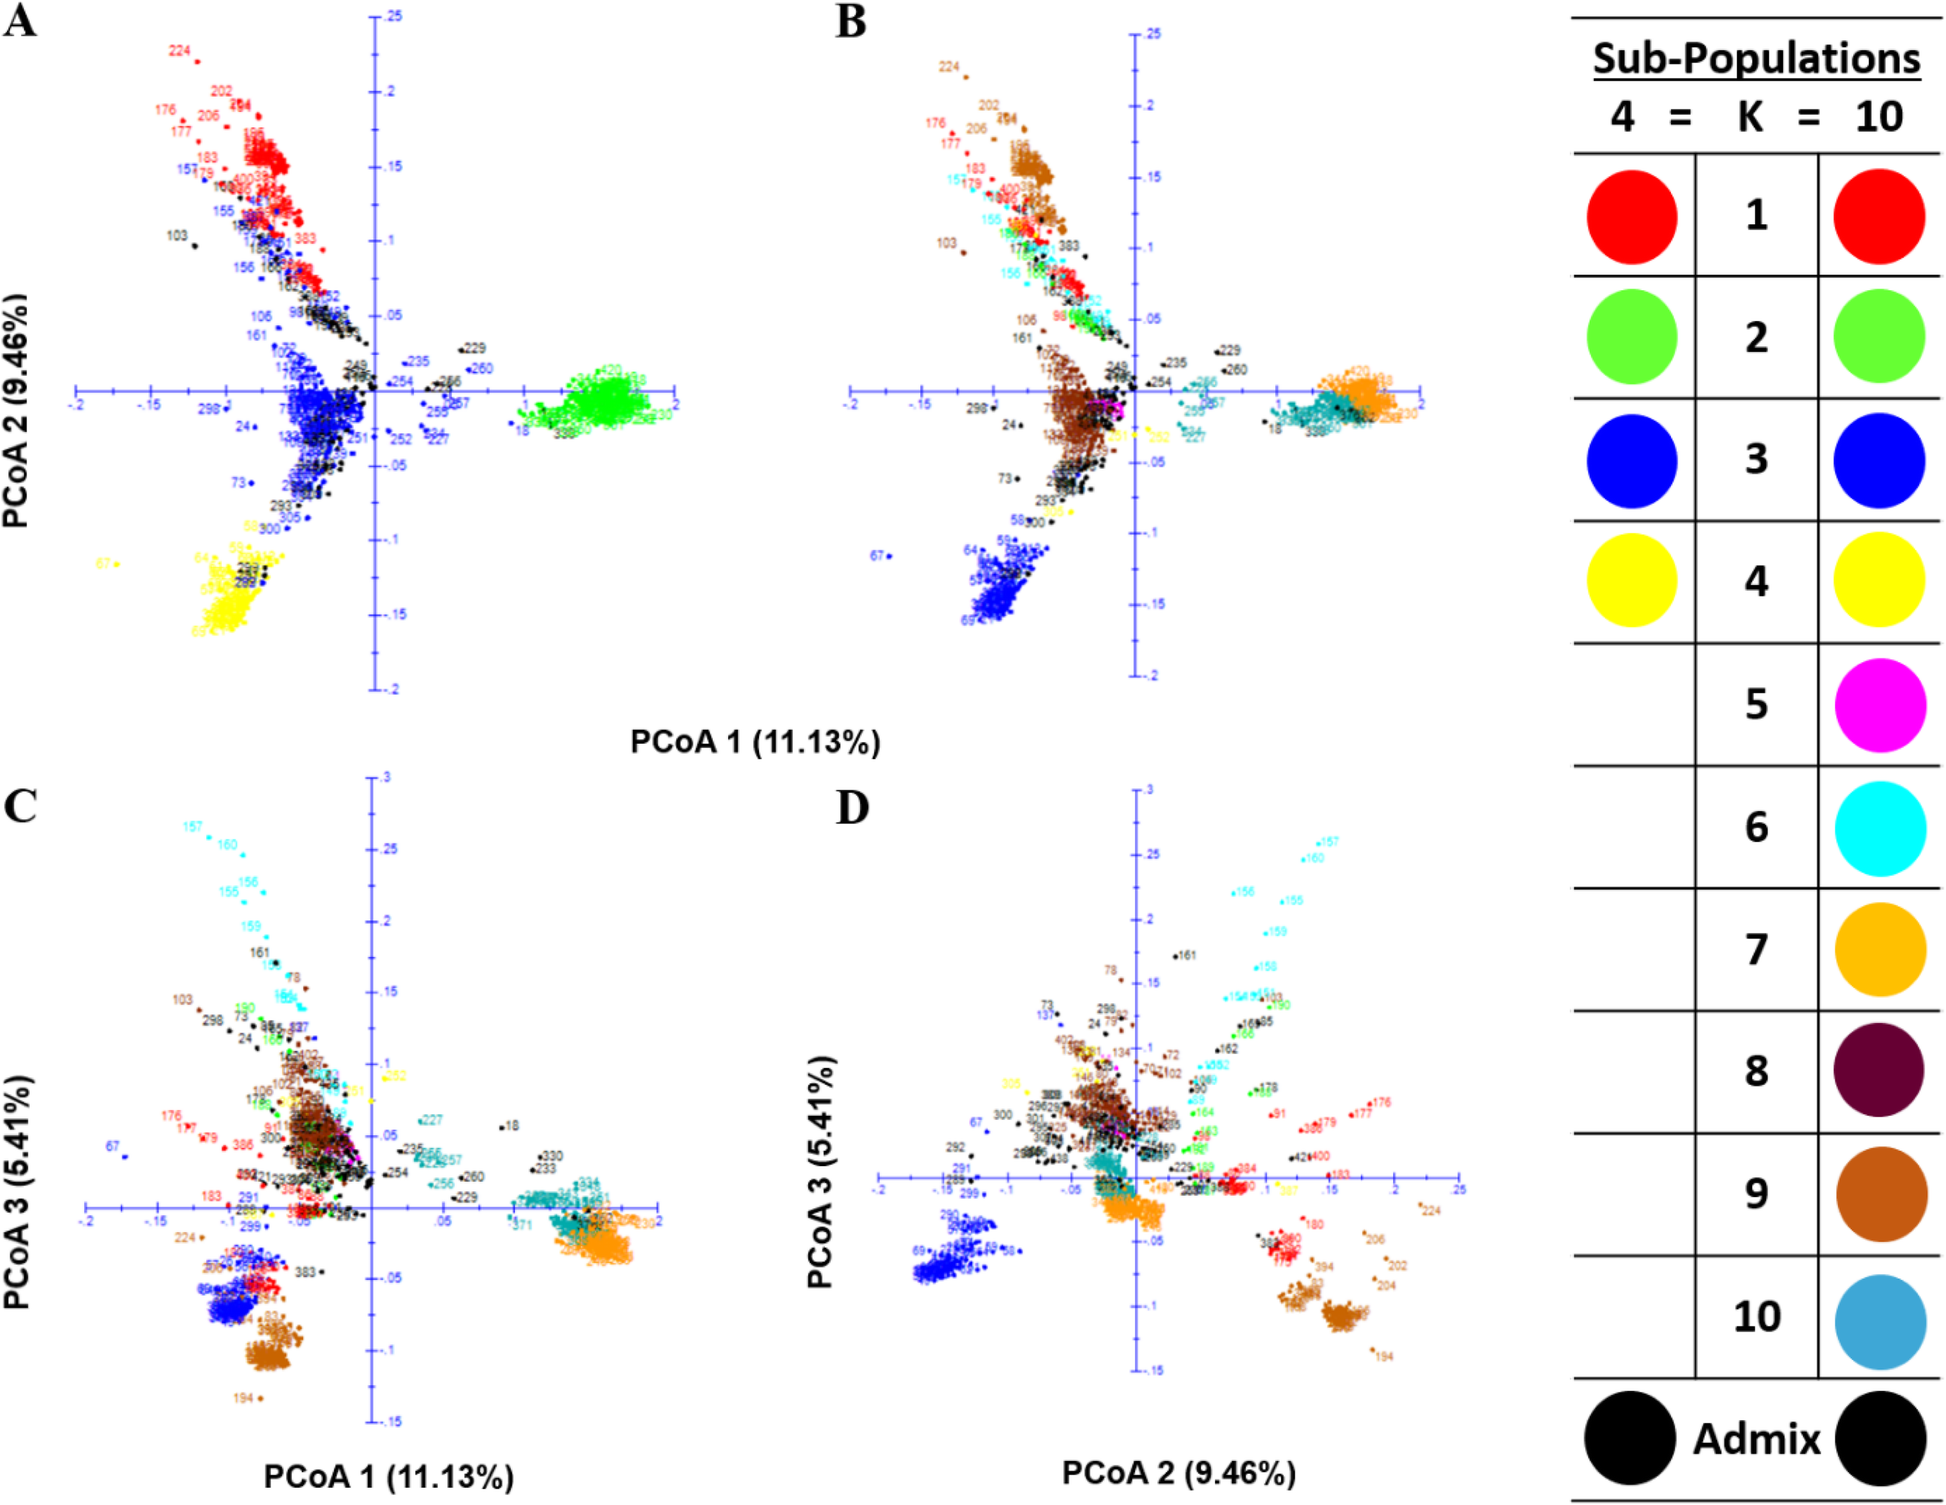
Principal coordinate analysis (PCoA) of the 439 maize inbred lines. Colour-coded according to membership (based on > 60% identity) to sub-populations identified from structure analysis at K = 4 (a) and 10 (c-d)

Principal coordinate analysis (PCoA) of the 439 maize inbred lines. Colour-coded according to membership (based on > 60% identity) to sub-populations identified from structure analysis at K = 4 (a) and 10 (c-d)