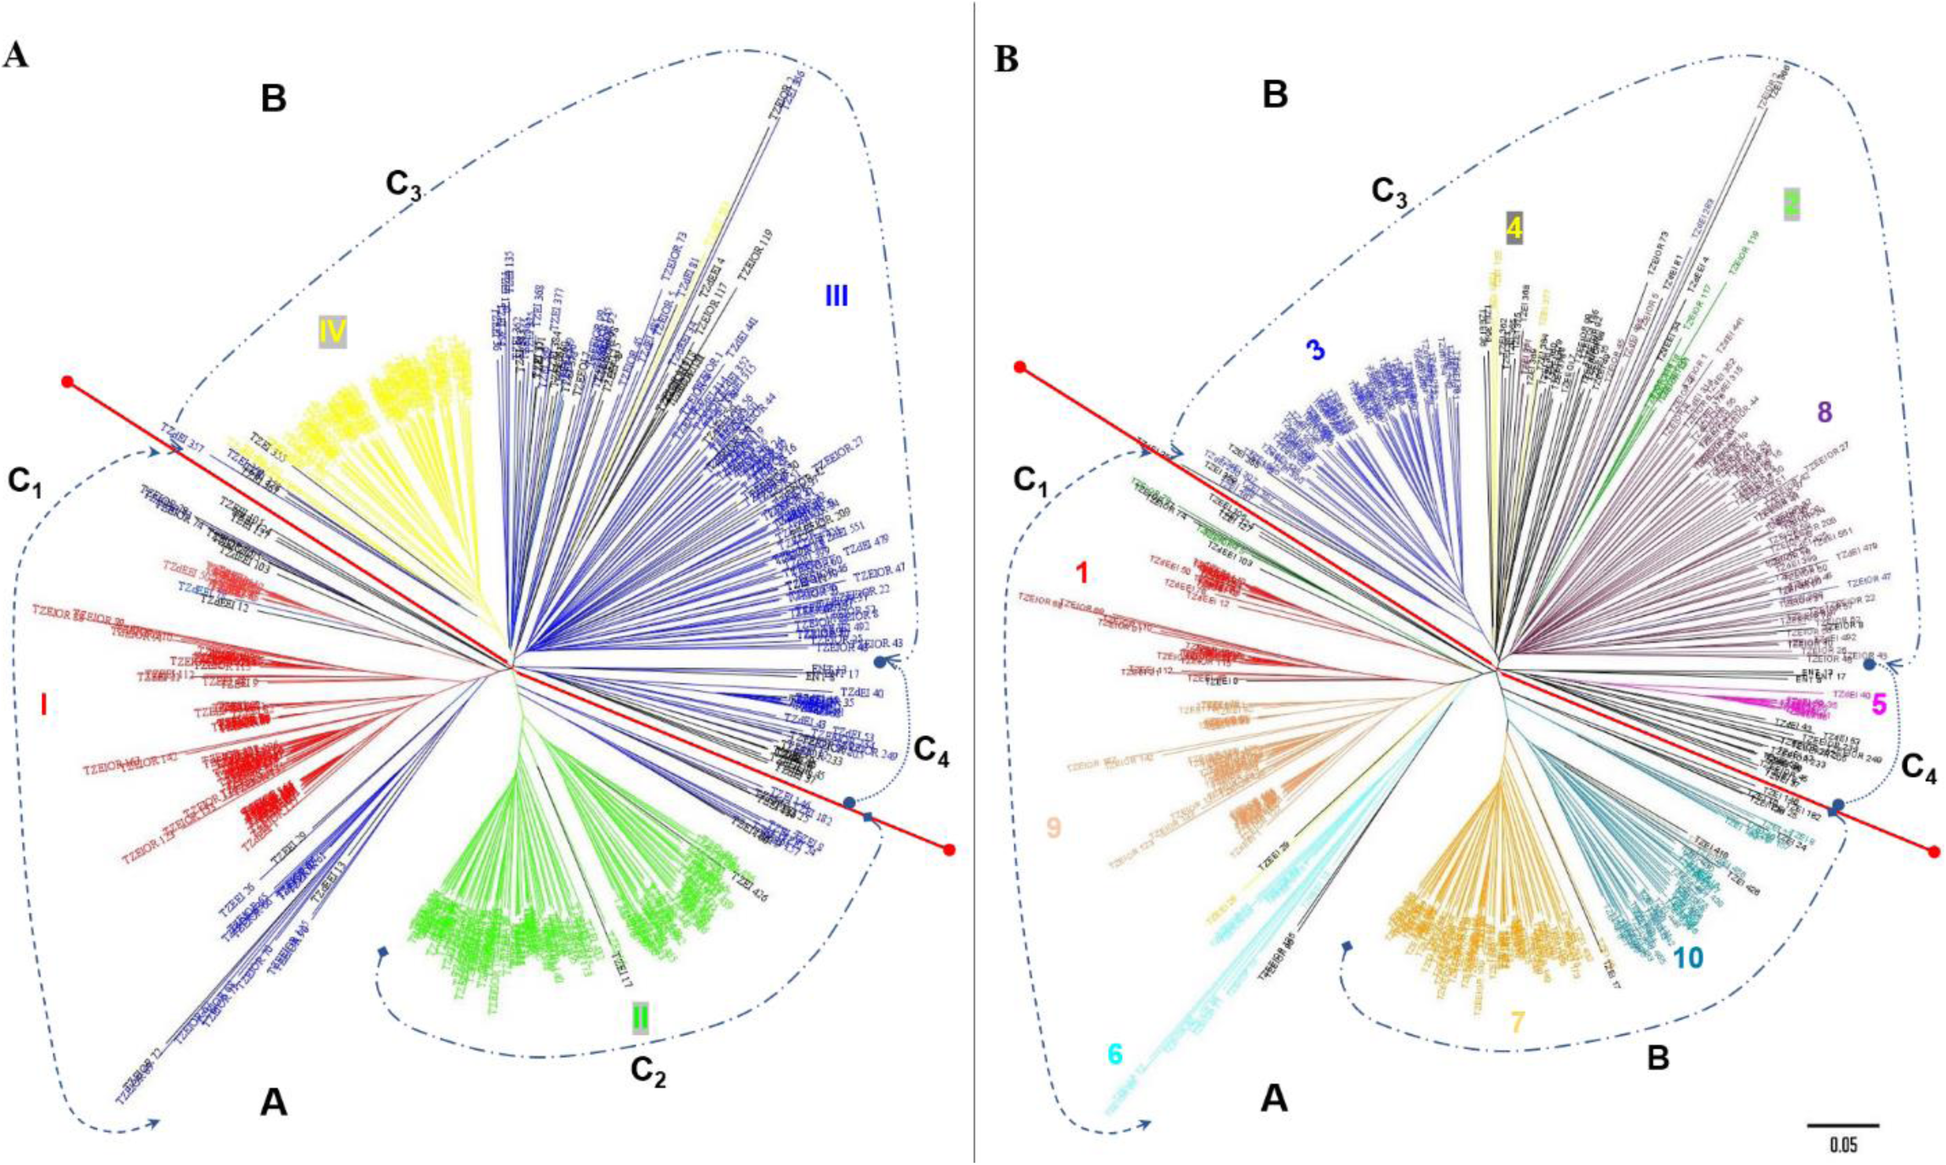
Fig. 3

Neighbor-joining phylogenetic trees of the 439 maize inbred lines based on 9642 DArT markers. NJ trees compared with STRUCTURE results A) K = 4 and B) K = 10. The colour patterns are equivalent to the STRUCTURE analysis where individuals were assigned to their respective sub-populations/groups based on a 60% of threshold cutting. Black colour represents admixture inbred lines
