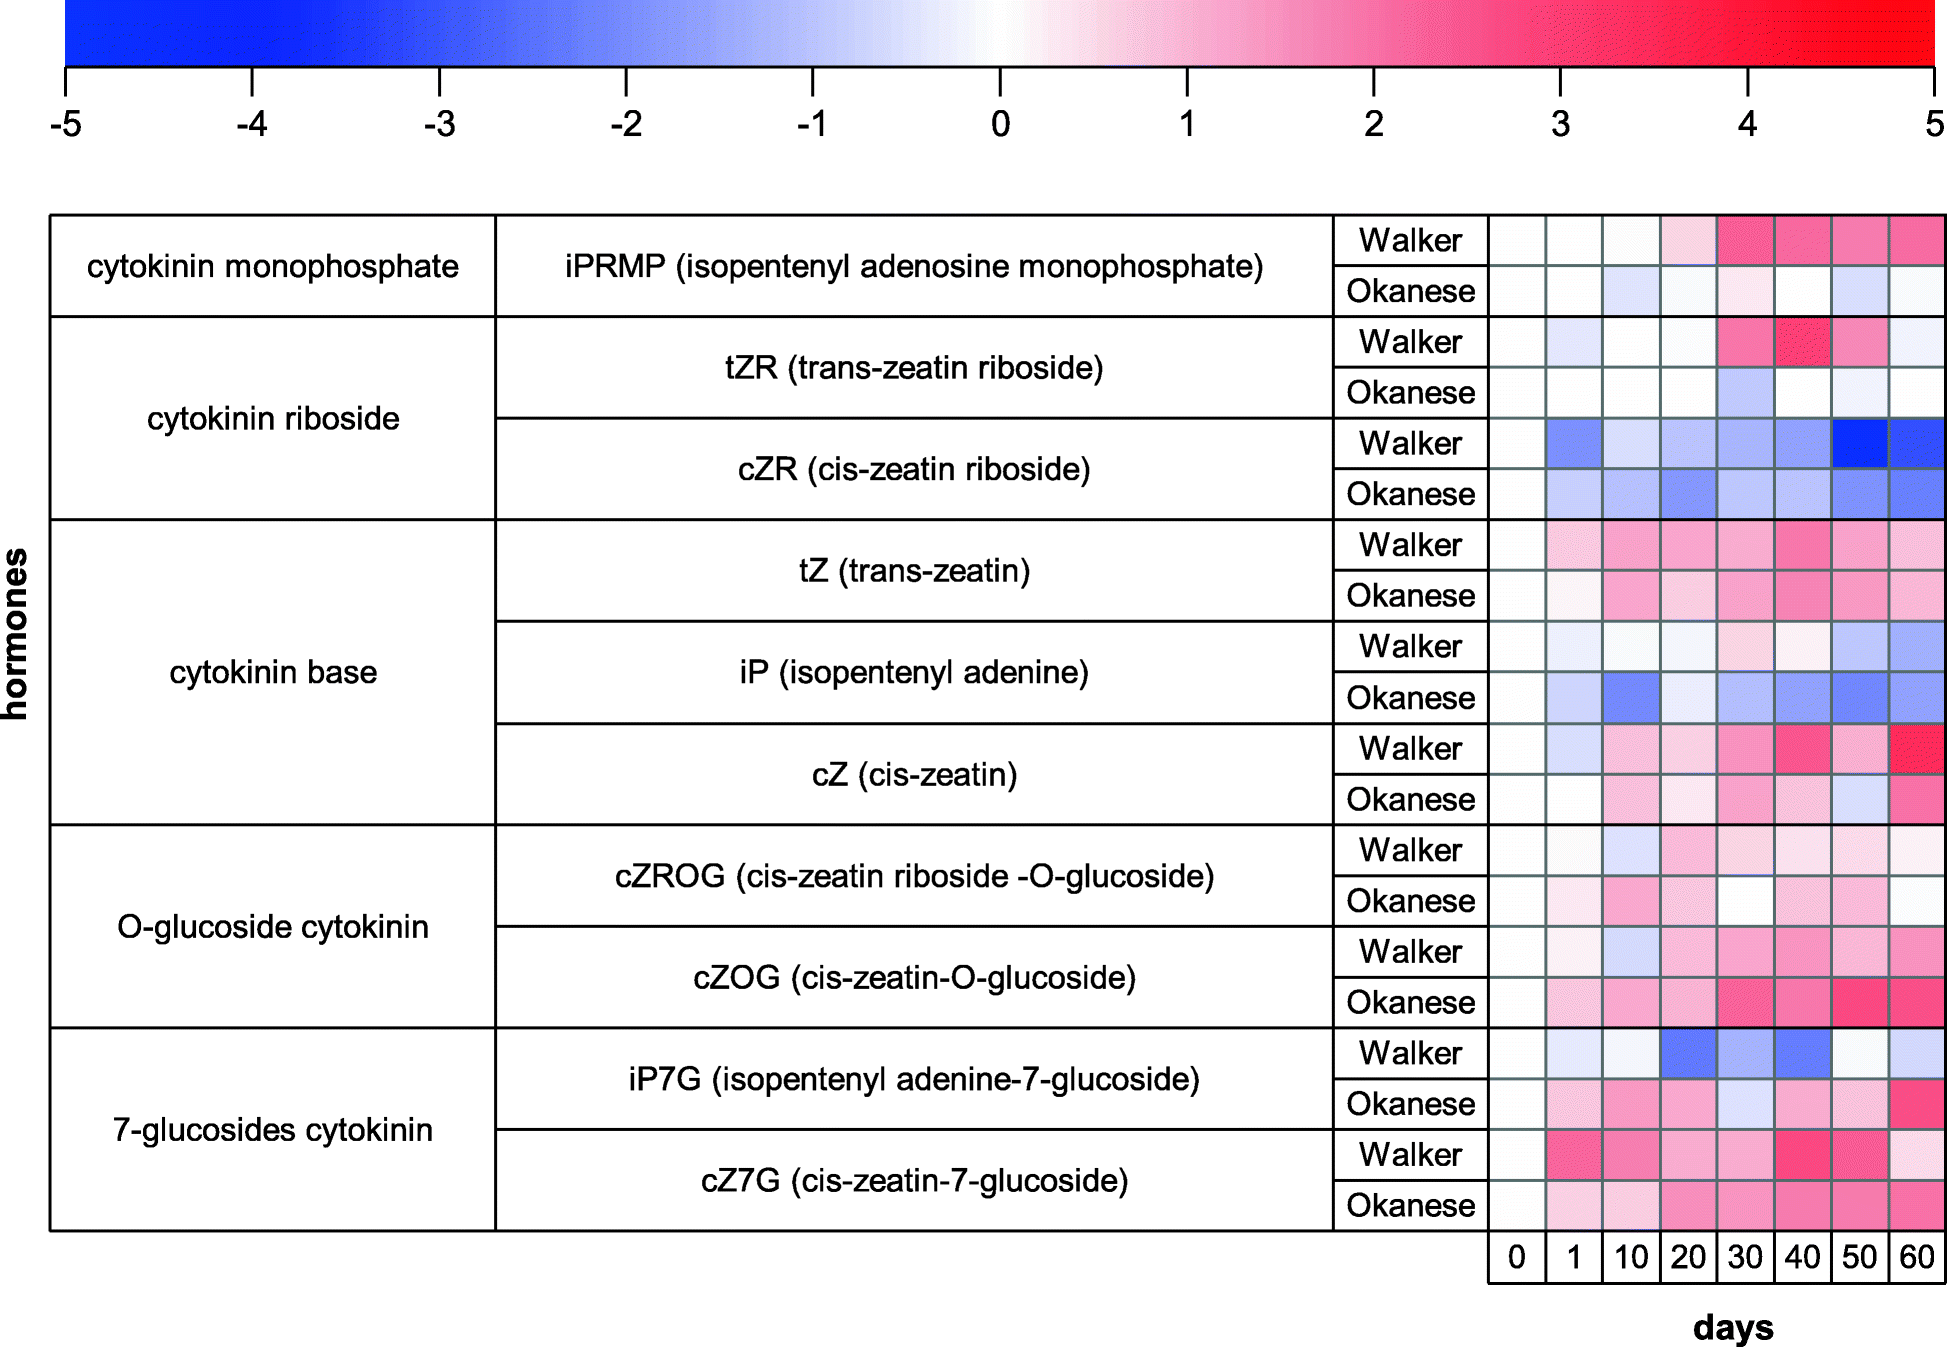
Fig. 9

Heatmap of the levels of cytokinin metabolites in the leaves of Walker and Okanese poplar genotypes. Colour scale represents the log2transformation of the ratio between concentration measured at the given sampling time and concentration measured on day 0. The up to down order of the presented hormones is following the metabolic pathway from precursors (iPRMP, tZR, cZR) through active (iP, tZ, cZ) to deactivated (CK O-glucosides and N-glucosides) forms
