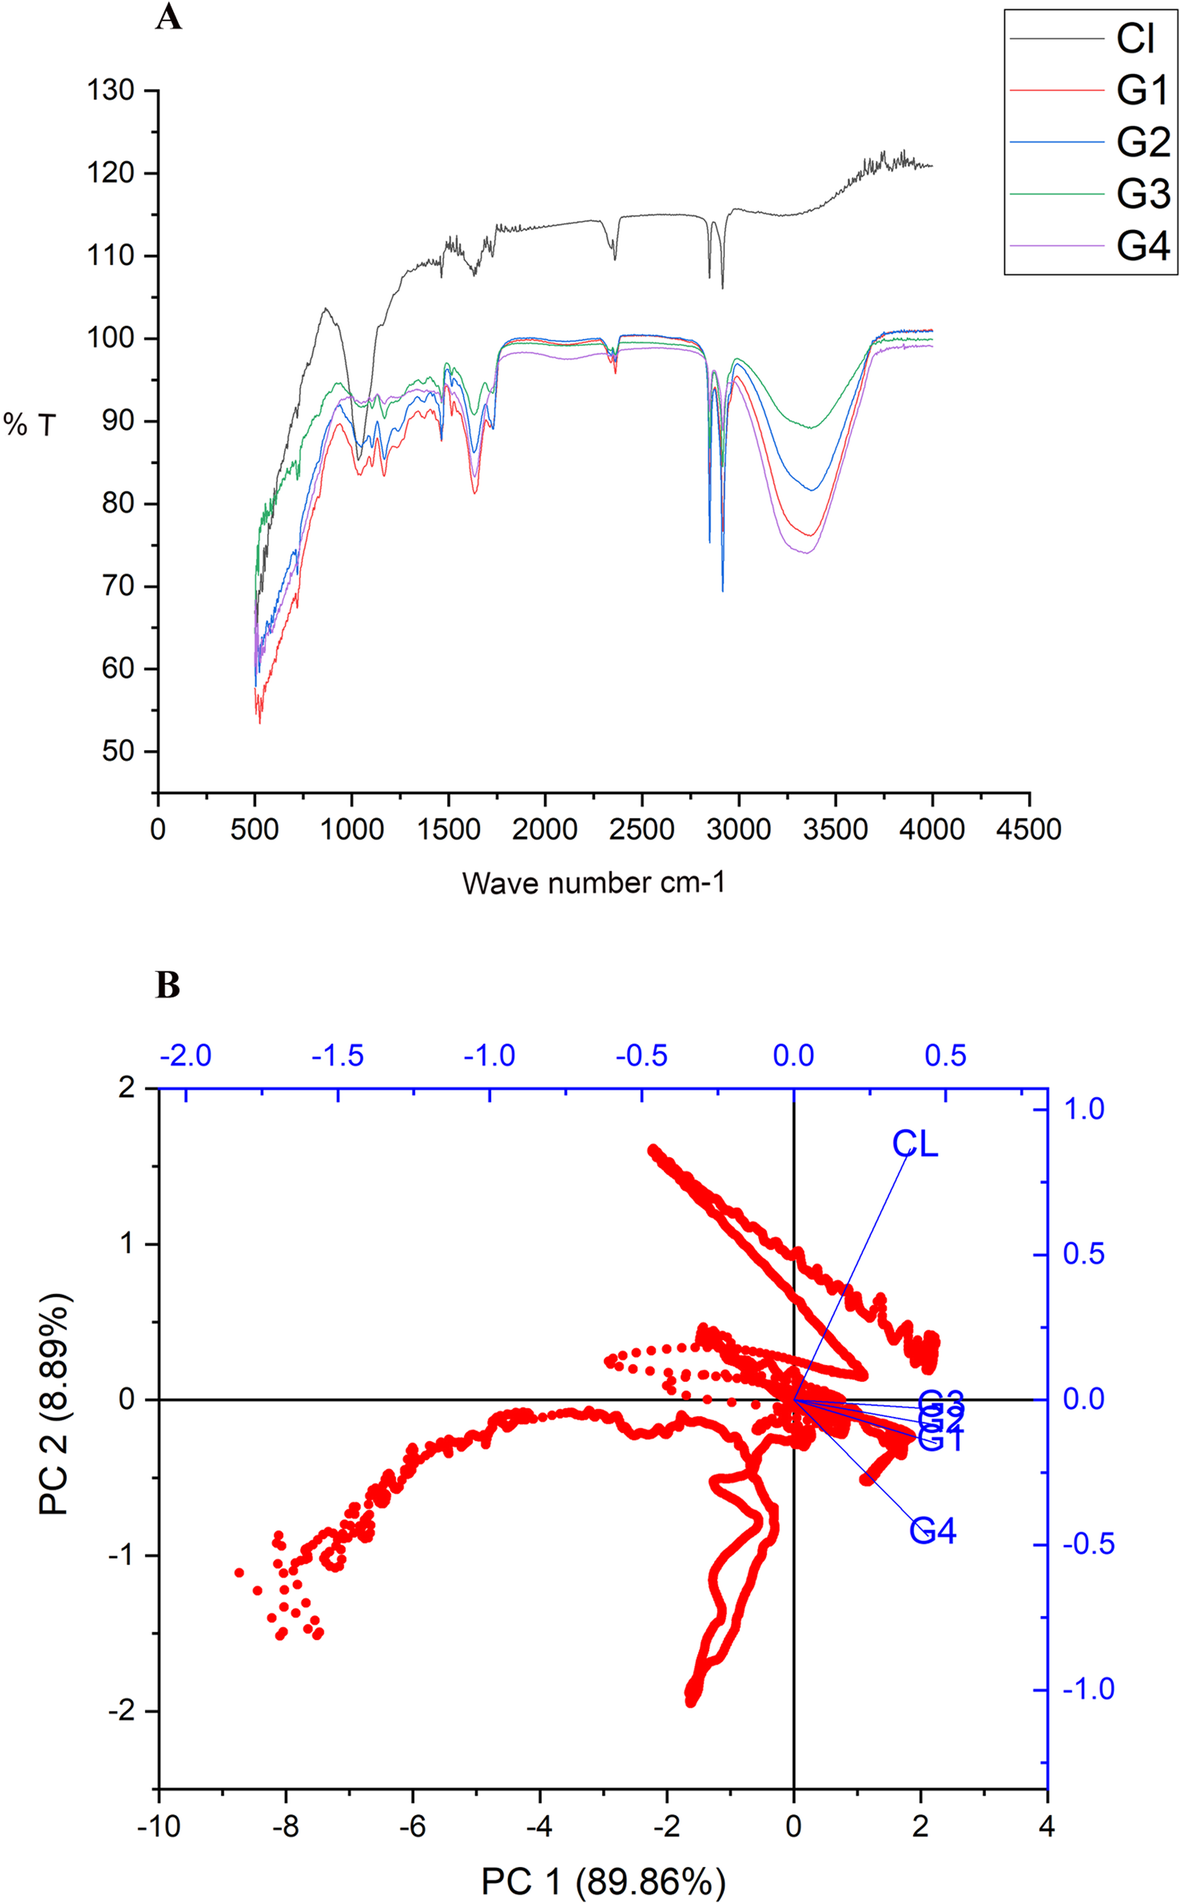
Fig. 9

aCombined ATR-FTIR spectrum of different developmental stages of the gall and control leaf. Control leaf -Cl, Gall 1st stage – G1, Gall 2ndstage – G2, Gall 3rdstage – G3, Gall 4thstage – G4.bPCA Biplot of ATR-FTIR spectrum of different developmental stages of leaf gall. Cl-Control leaf, G1-Gall 1ststage, G2- Gall 2ndstage, G3- Gall 3rdstage & G4- Gall 4thstage
