Fig. 3

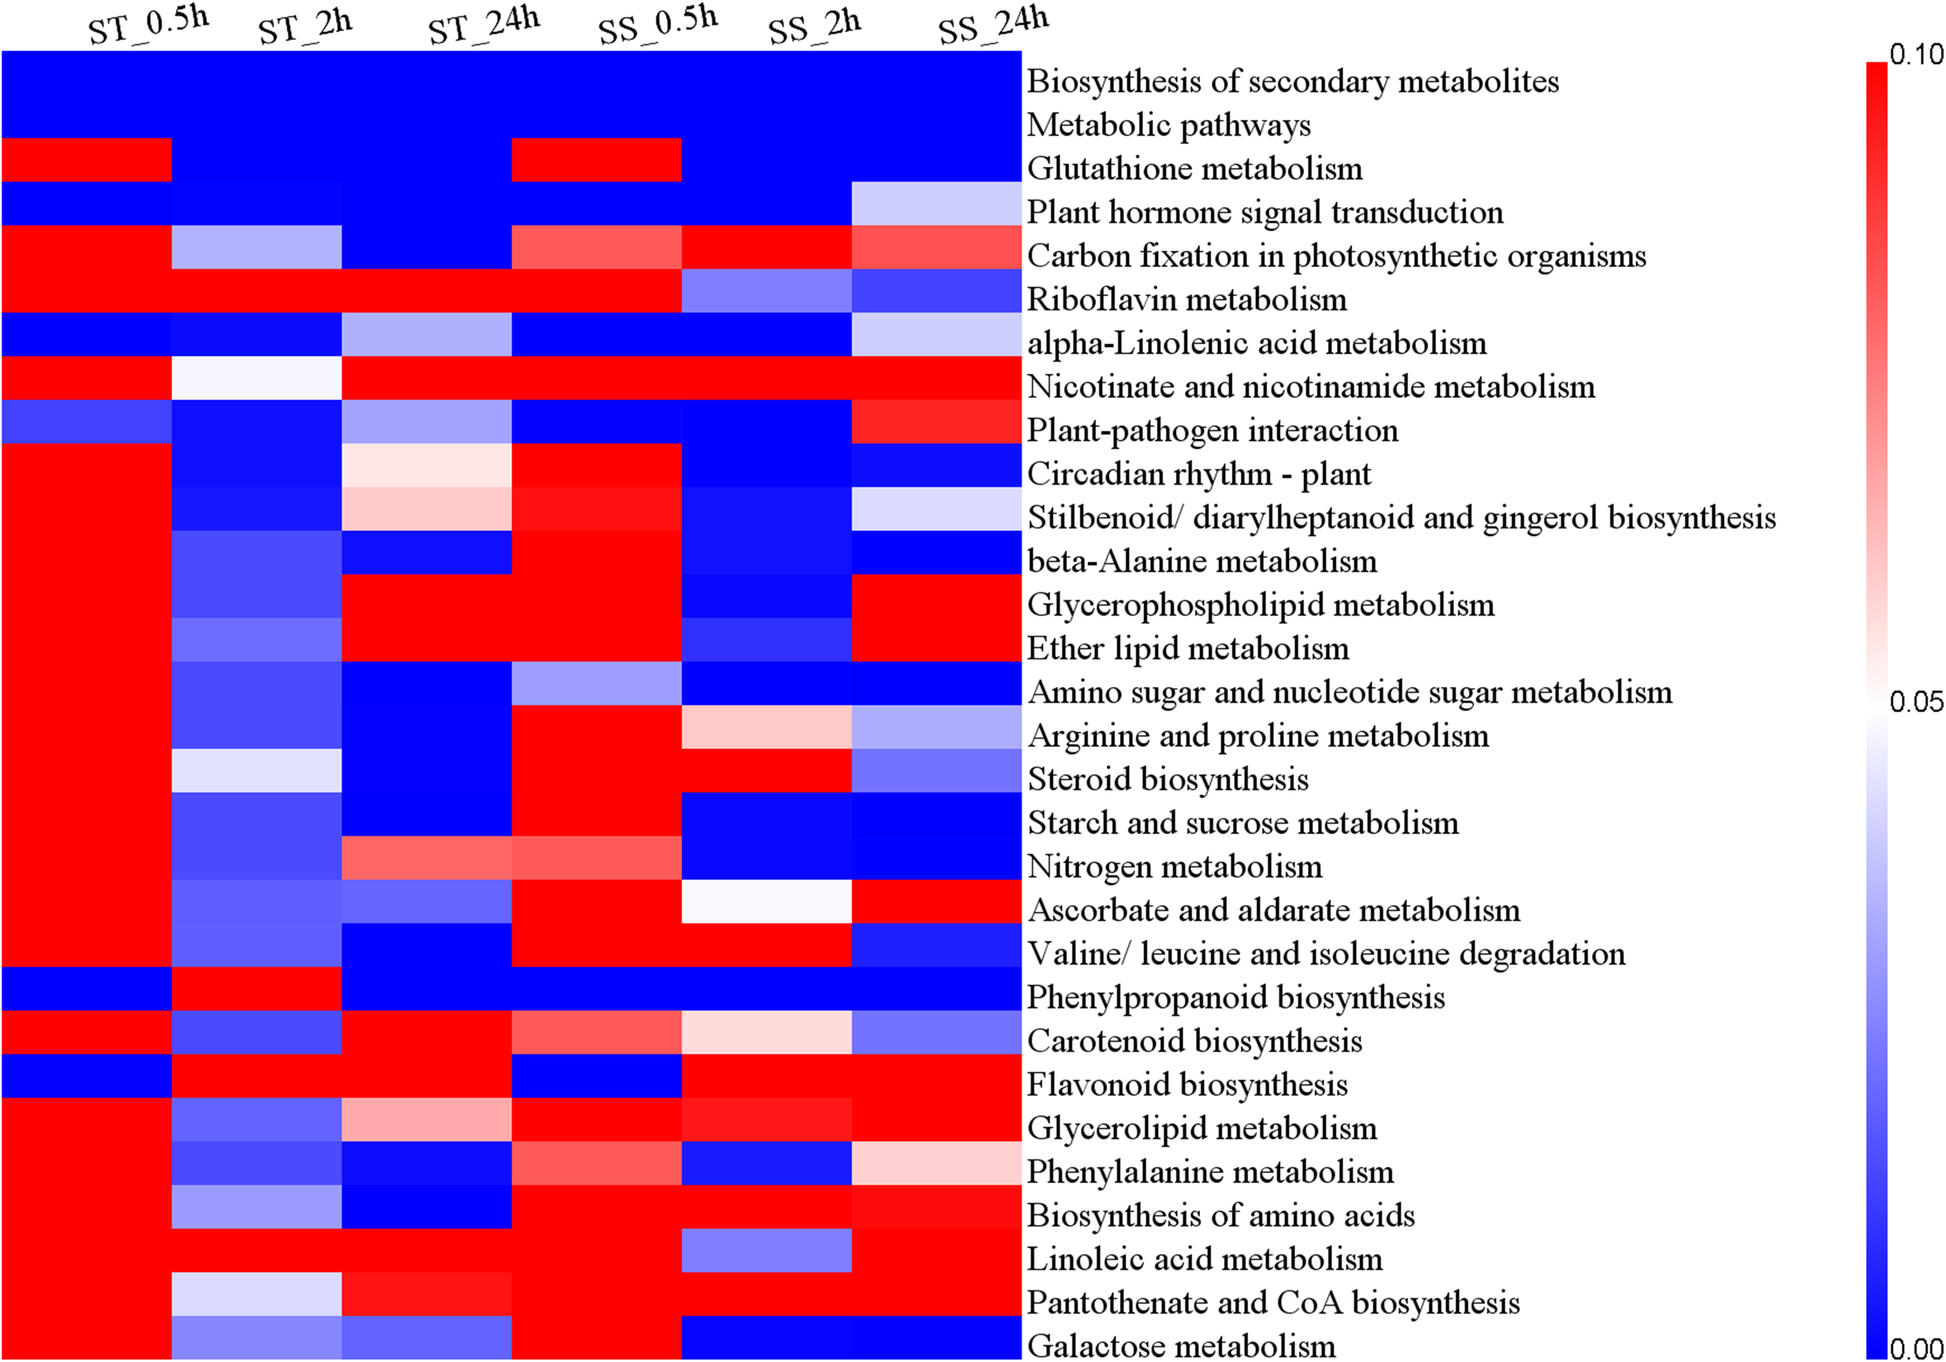
KEGG pathway classification and enrichment analysis of the DEGs in ST and SS at different salt stress time points. Blue color represents significant enrichment, red color represents non-significant enrichment

KEGG pathway classification and enrichment analysis of the DEGs in ST and SS at different salt stress time points. Blue color represents significant enrichment, red color represents non-significant enrichment