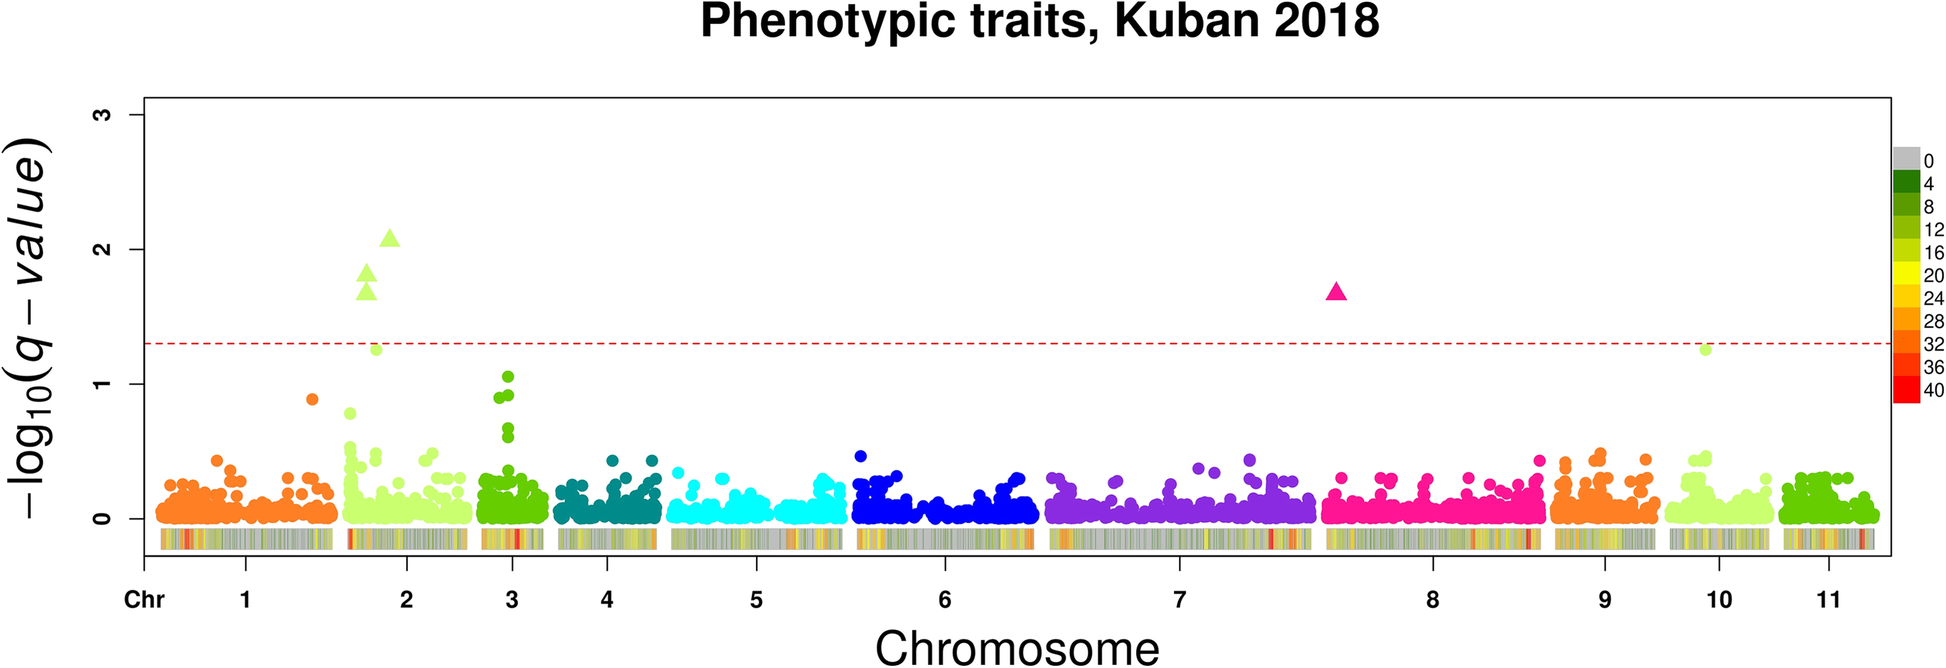
Fig. 3

Summary of GWAS analyses for phenotype data (possibility of maturation and hypocotyl colour) measured in Kuban (different colors correspond to different chromosomes). SNPs withq-value < 0.05 are shown for each chromosome, marked as triangles. When one position associates with a number of phenotypes with different q-values, only the most significant SNP is represented
