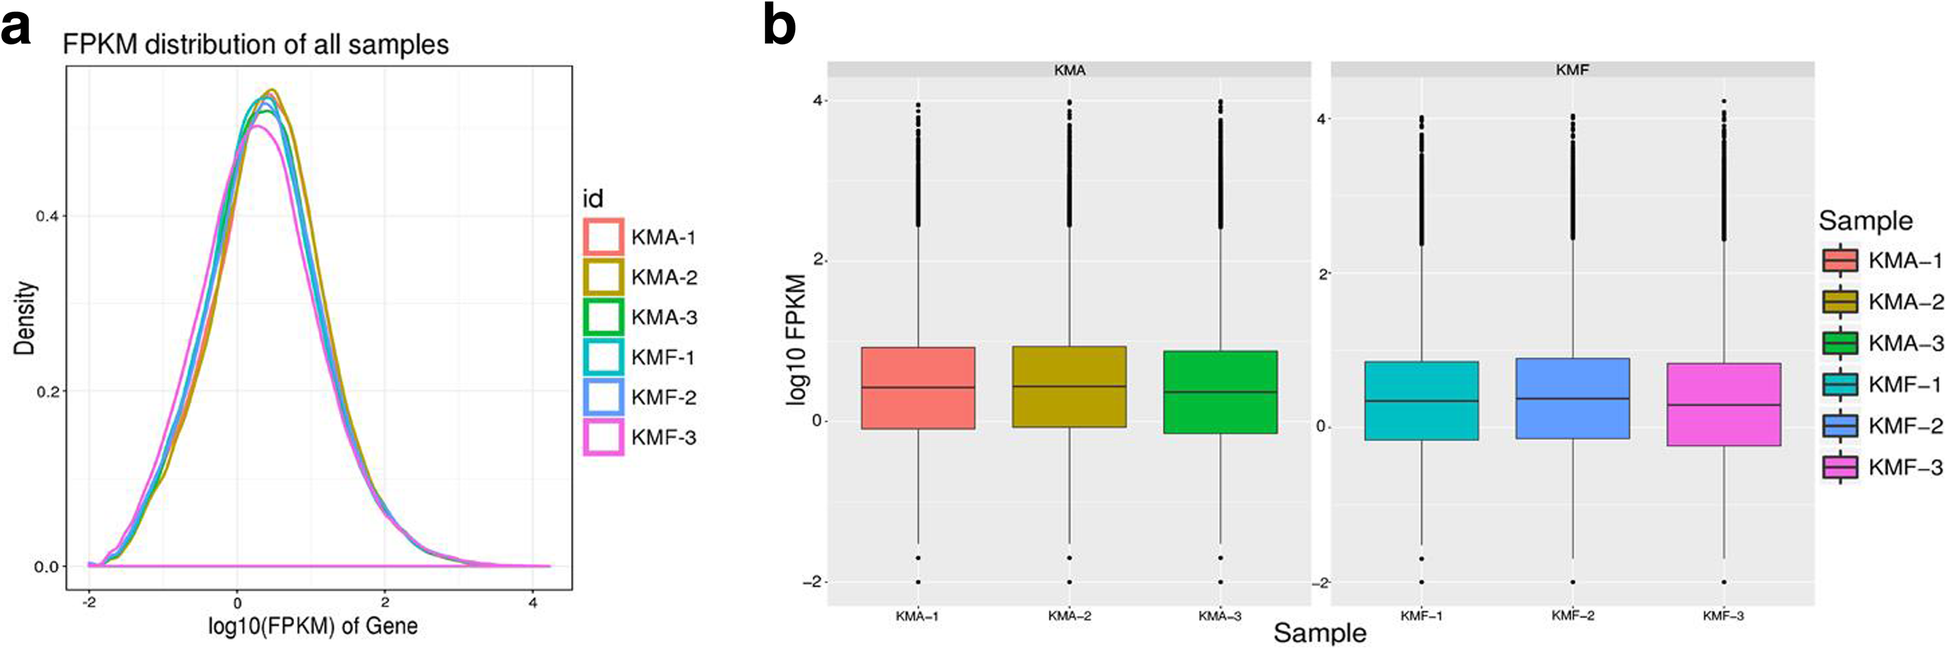
Fig. 2

FPKM density and box plot FPKM distributions for each sample. The different colored curves denote different samples. The horizontal axis indicates the FPKM for the corresponding sample and the vertical axis indicates the corresponding probability density (a). The horizontal axis represents different samples and the vertical axis represents the FPKM for samples (b). KMA comprises three biological repeats for KMA-1, KMA-2, and KMA-3. KMF comprises three biological repeats for KMF-1, KMF-2, and KMF-3
