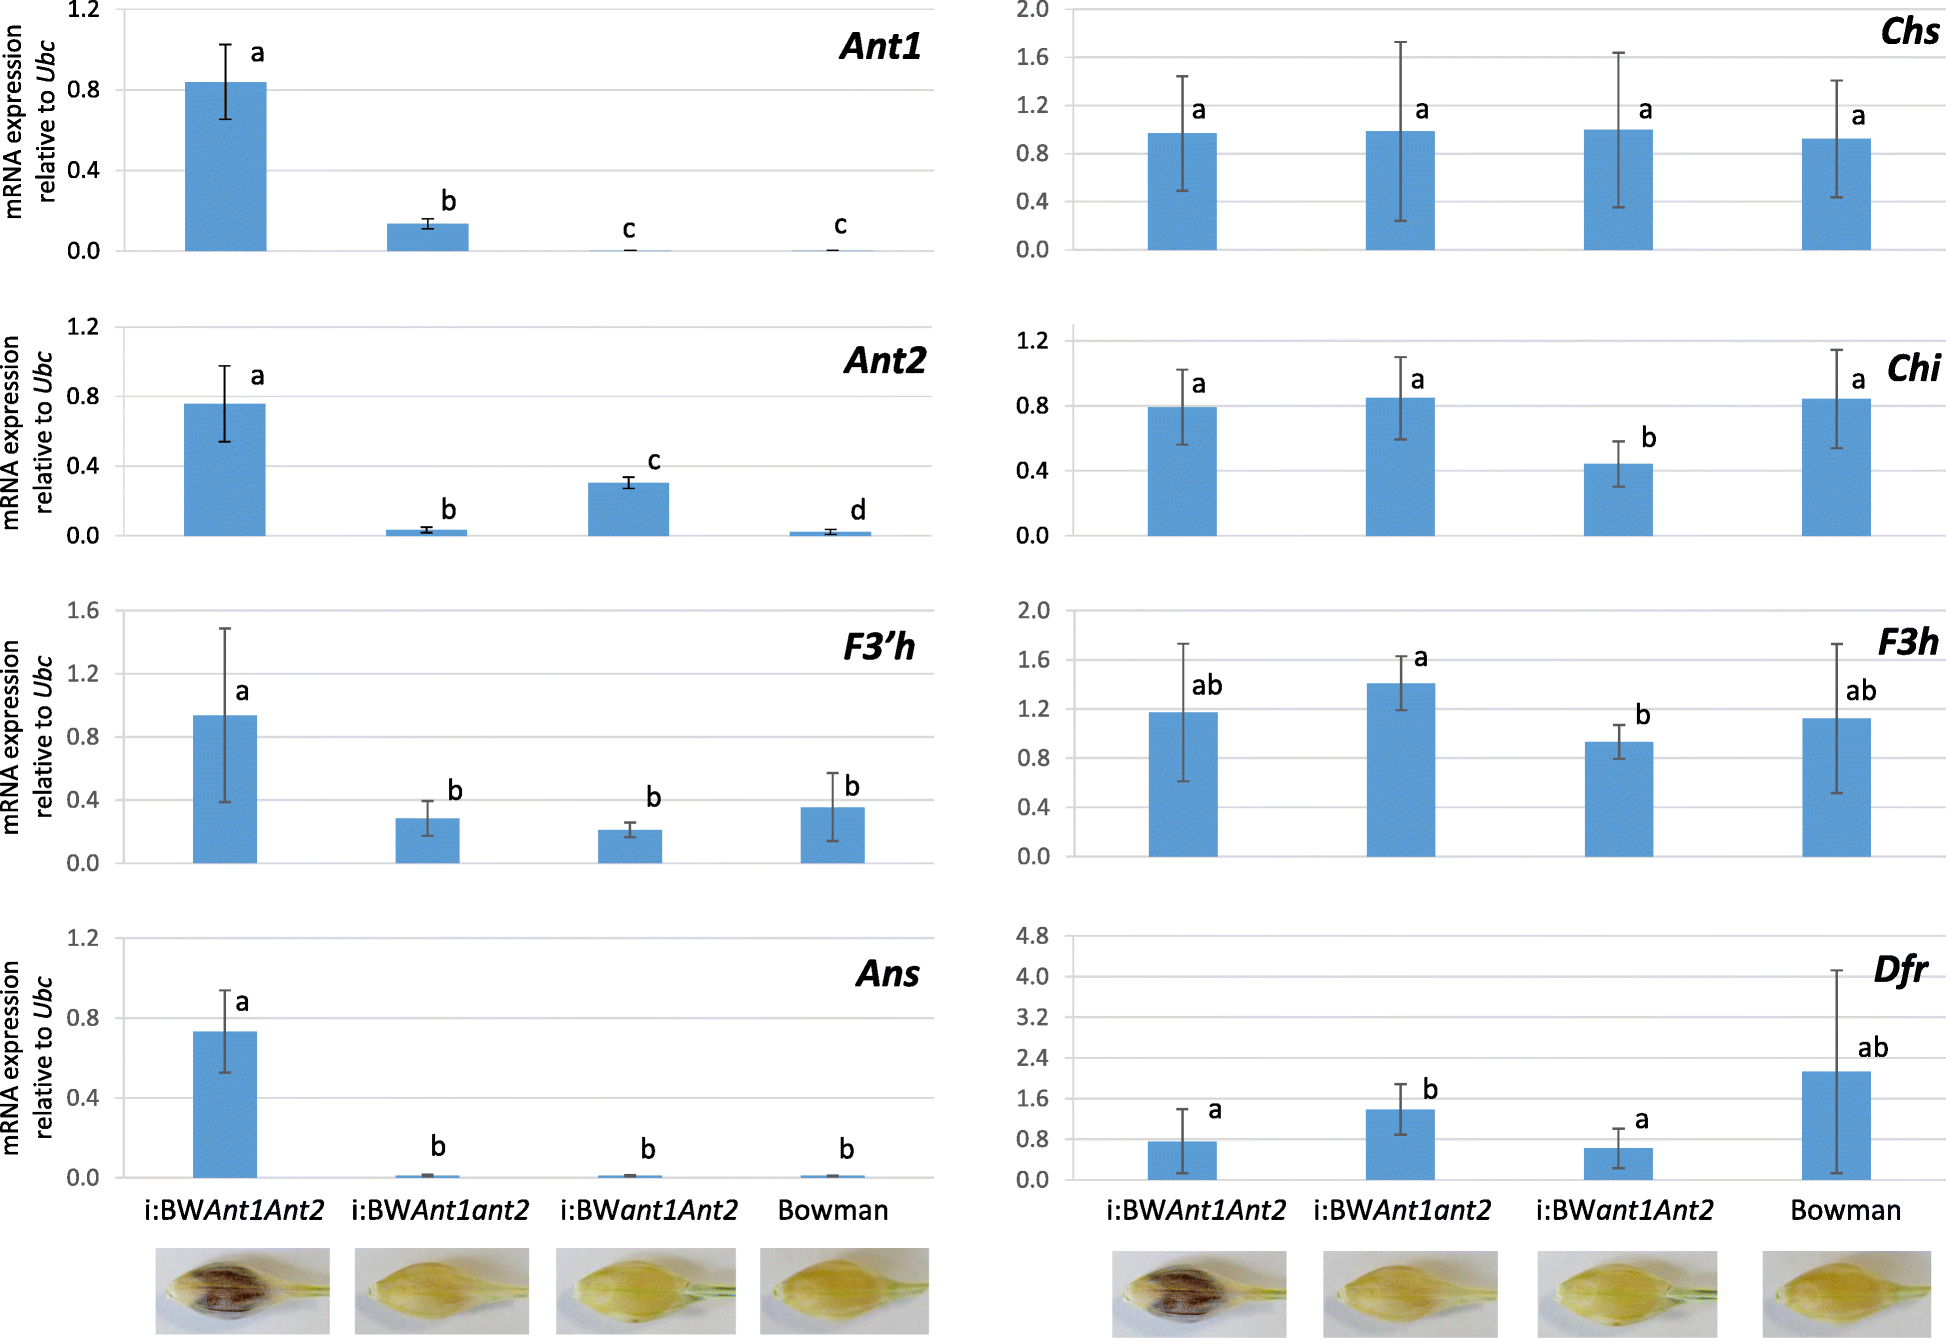
Fig. 4

Expression of the anthocyanin biosynthesis genes in lemma and pericarp of the barley NILs with different alleles of theAnt1andAnt2genes. The data are presented as mean ± standard deviation. The different letters mean statistically significant differences between the lines (U-test,p ≤ 0.05)
