Fig. 5

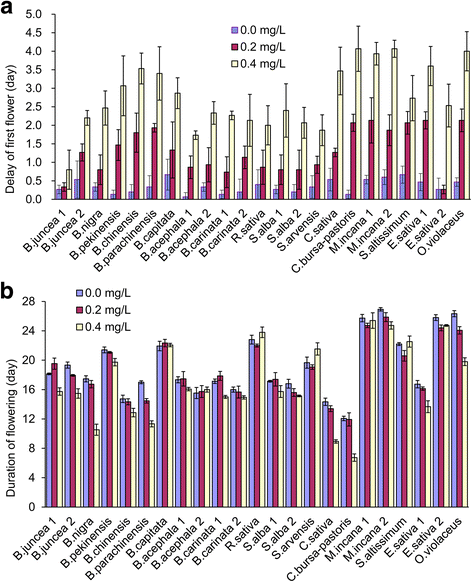
The delay of flowering (a) and the shortening of the duration of flowering (b) on different species resulting from 0.2 and 0.4 mg/L tribenuron-methyl applications. Error bars represent ± one standard deviation

The delay of flowering (a) and the shortening of the duration of flowering (b) on different species resulting from 0.2 and 0.4 mg/L tribenuron-methyl applications. Error bars represent ± one standard deviation