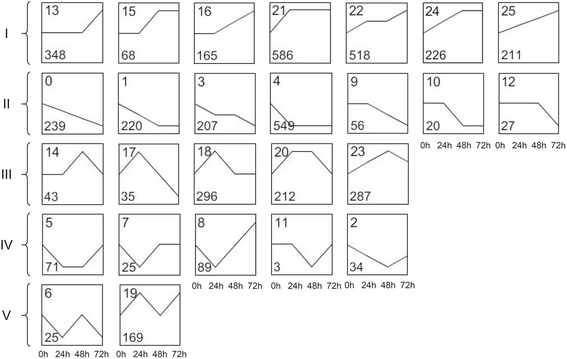
Fig. 3

Clustering and classification of 4,729 differentially expressed genes. The Roman numerals on theleftindicate the class. The number in thetop left cornerin each panel indicates the identification number (ID) of the 26 profiles that were identified, and the number in thebottom left cornerof each panel indicates the number of genes in the cluster
