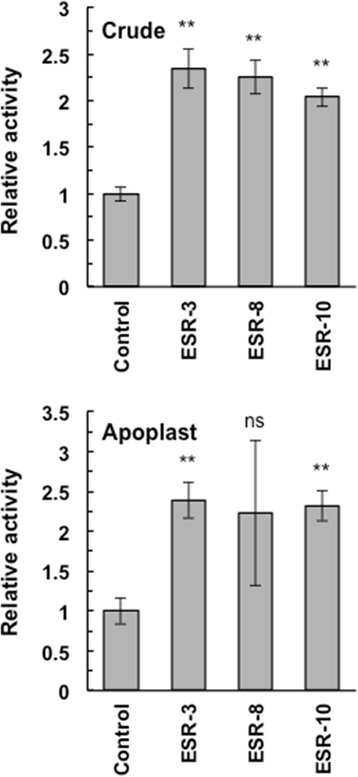
Fig. 3

RNase activity in the crude extract and apoplast fractions from ESR and control plants. Relative activity is shown with standard errors (n = 8 for the crude extract andn = 3 for apoplasts). Significant differences atP < 0.01 and no significant differences between ESR and control plants, calculated using thet-test, are indicated by ** and ns, respectively
