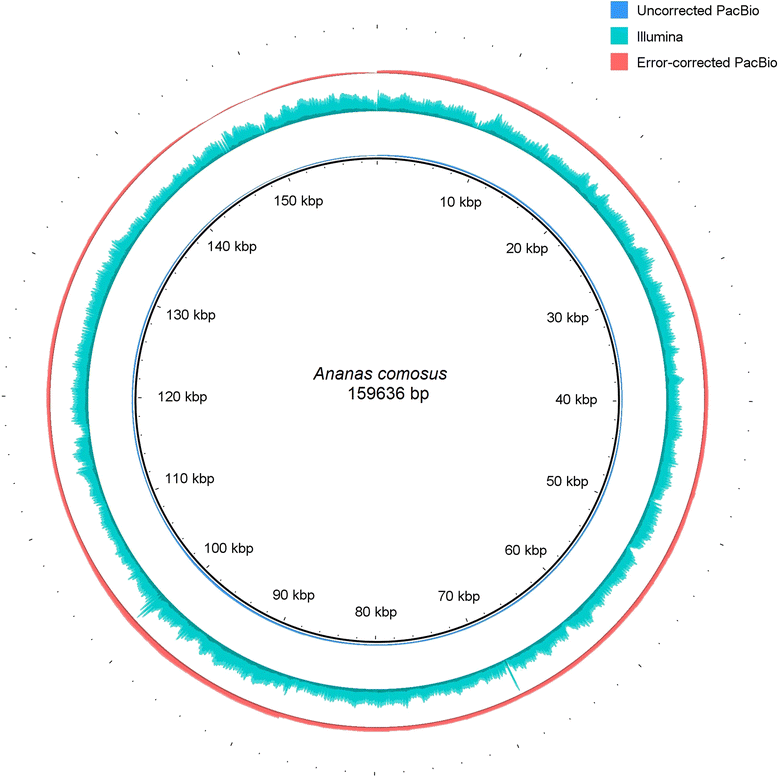
Fig. 2

The coverage profile of the pineapple chloroplast after mapping back the error corrected, uncorrected and the Illumina short reads. Each three rings represented the depth of coverage from mapping back reads used in the assembly of the pineapple chloroplast genome. From the outermost to the innermost, the ring represents the corrected PacBio, the Illumina short reads and uncorrected PacBio mapped to the chloroplast genome of pineapple. The height of each ring is in proportion to the number of reads mapped across the chloroplast genome. Figure was illustrated using BRIG [41]
