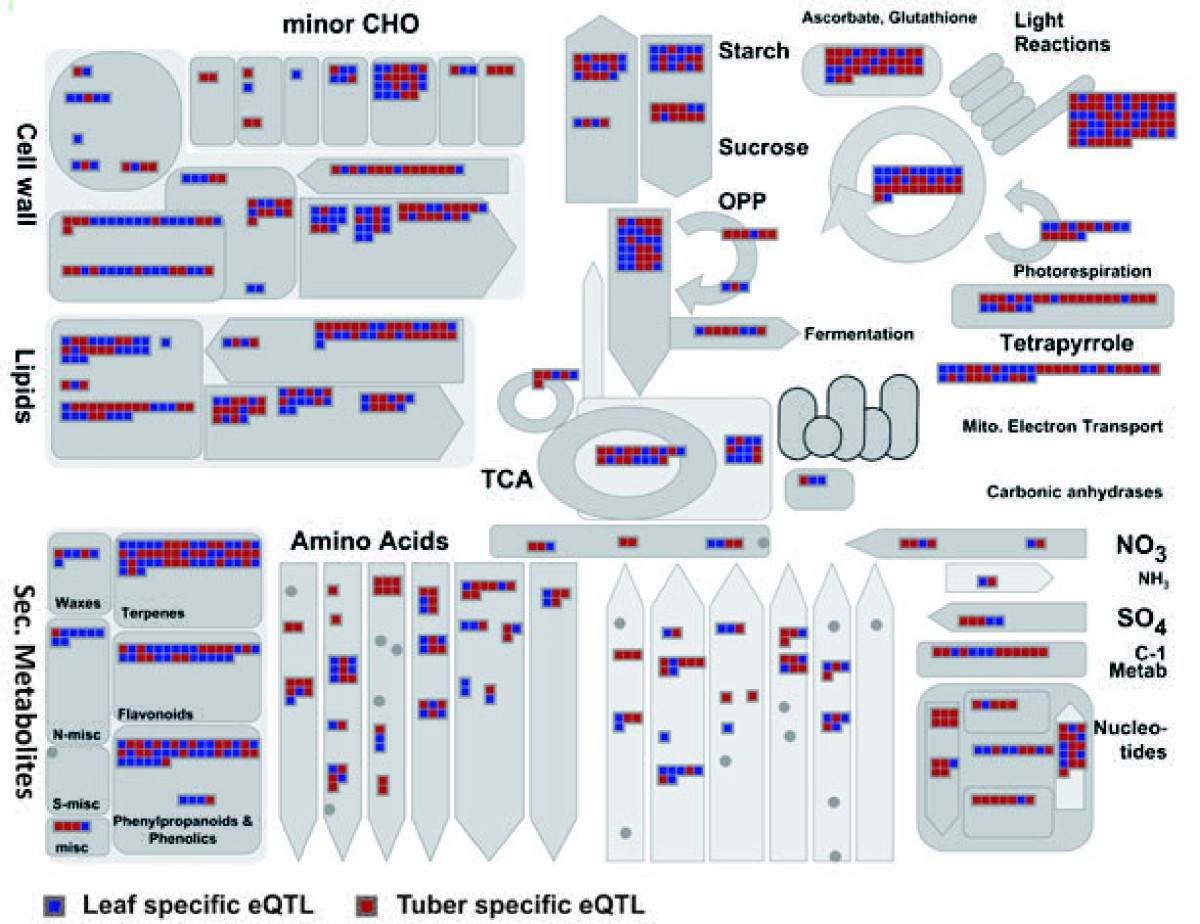
Figure 3

Tissue dependent eQTLs associated to metabolic pathways. Overview of identified tissue dependent eQTLs for genes involved in the major metabolic routes (grey boxes). Genes exhibiting potato tuber specific eQTLs are indicated in red-boxes while leaf specific eQTLs are represented in blue boxes. Each coloured box represents a single array feature and only genes for which an eQTL has been identified are visualized. Within the MapMan software additional information on gene identity and function can be obtained.
