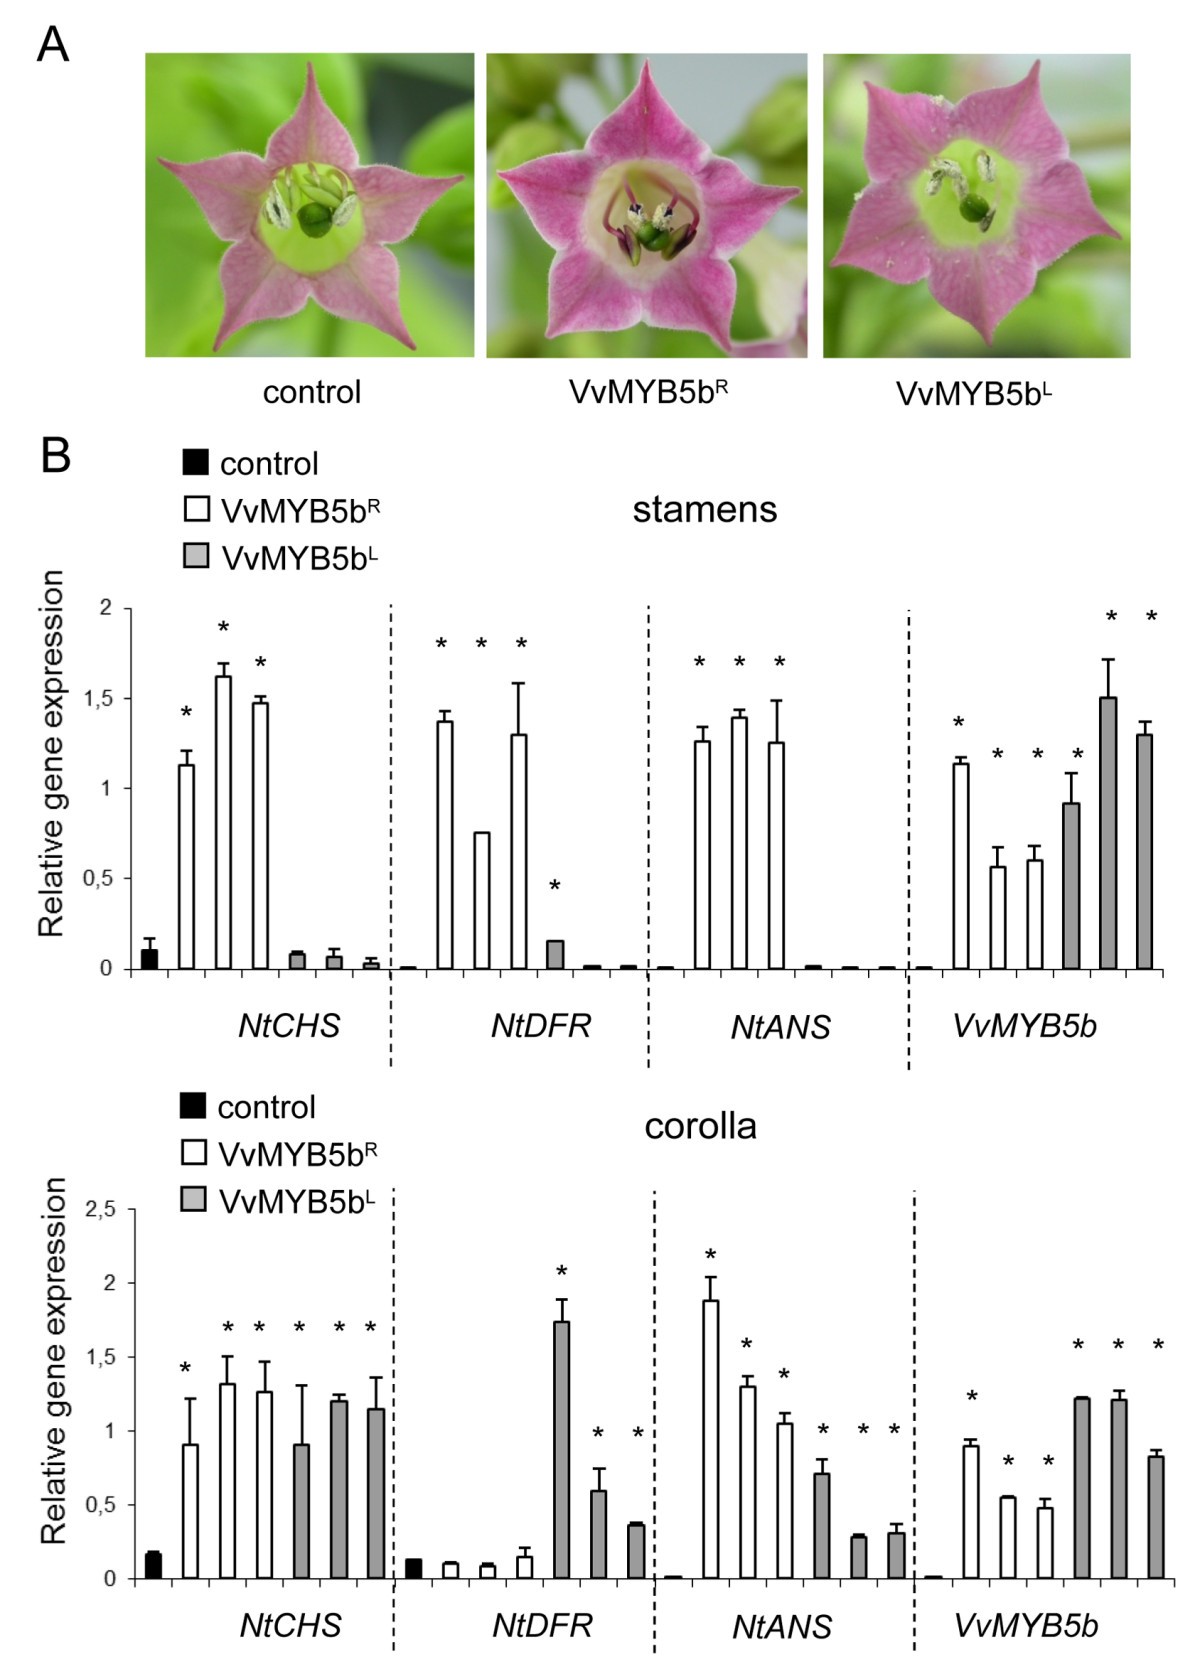
Figure 5

Analysis of VvMYB5bRand VvMYB5bLectopic expression effect in tobacco plants flowers. (A) Flowers ofVvMYB5bRoverexpressing plants showed an intense red coloration of petals and stamens, compared to control andVvMYB5bLtransgenic flowers. (B) Real time quantitative RT-PCR analysis ofNtCHS(chalcone synthase),NtDFR(dihydroflavonol reductase) andNtANS(anthocyanidin synthase) transcript abundance in stamens and corollas. Gene expression is shown relative toNtUbiquitintranscript levels in each sample. Results are presented for three independent transgenic lines overexpressing eitherVvMYB5bRorVvMYB5bL, and compared to control plants.VvMYB5bindicate transgene transcript levels. Each bar represents the mean ±SD of three replicates (*P< 0.05 vs. control plants according to the ANOVA).
